Incidents Sensor – Bitdefender TechZone
2026-09-11
Incidents Sensor detects across the attack lifecycle—network discovery, persistence, Living off the Land (ProcDump dumping LSASS), credential theft, ransomware staging, all mapped to MITRE ATT&CK. Feeds Correlation Engine, PHASR, custom detection rules, threat hunting, EDR and XDR.
Wherever an intrusion starts, a phished mailbox, a stolen cloud key, an unmanaged device, its goal is executing on an endpoint. The Incidents Sensor records that moment in the highest detail: what runs, what it changes on disk and in the registry, and where it connects out. That record feeds two engines. The Correlation Engine for EDR turns it into detections on the machine itself, and the Correlation Engine for XDR combines it with what the network, identity, cloud, and productivity sensors saw, showing the full attack path from the initial point of compromise to every resource.
What the Incidents Sensor Collects and Detects
The Incidents Sensor collects detection telemetry from BEST agent components such as Network Attack Defense and Fileless Protection, and monitors endpoint activity directly: running processes, network connections, registry changes, and user behavior.
The sensor collects only metadata about this activity, not actual user data. That metadata is processed to detect suspicious activity on the system and generate incidents.
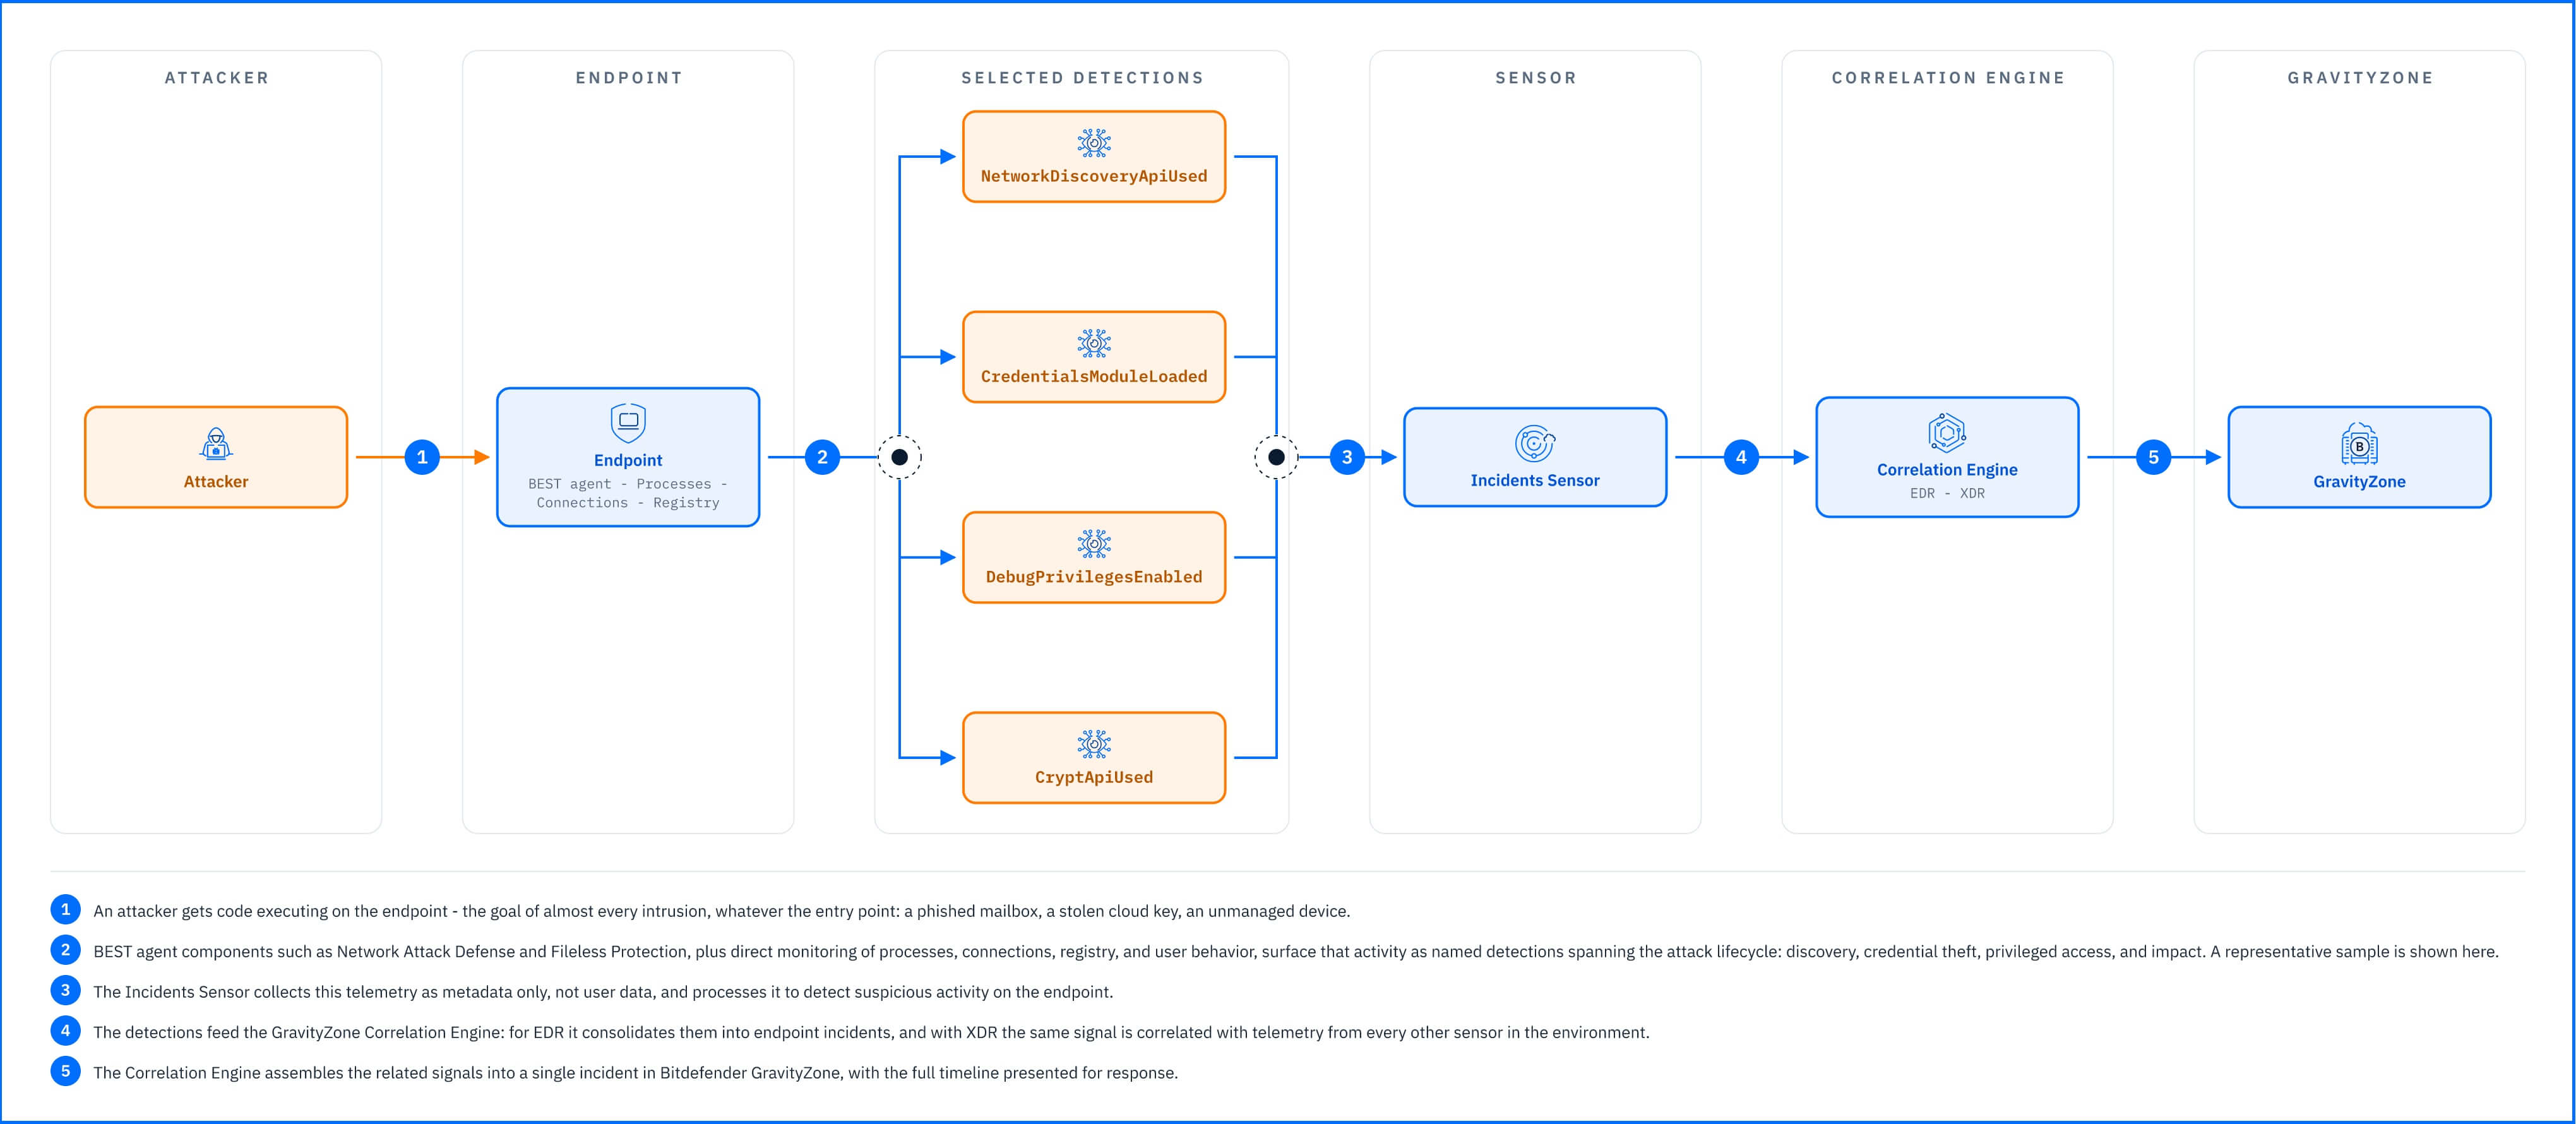 |
The sensor's detections, mapped to the MITRE ATT&CK framework, span the attack lifecycle from initial discovery through credential theft, privilege escalation, and defense evasion to final impact. A few examples show the range:
Network discovery: a process making Windows API calls to enumerate the network, the way attackers map devices before choosing where to move, raises the NetworkDiscoveryApiUsed alert.
Persistence: the sensor detects when a file reappears at startup with the same MD5 hash and command line, the pattern of an attacker keeping access across a reboot.To see these detections on a real attack, open the GravityZone Demo Incident, which breaks a complete ransomware attack chain into per-machine process graphs you can navigate detection by detection.
Living off the Land techniques: an attacker using ProcDump to dump LSASS memory surfaces through alerts such as SuspiciousSignedProcessExecution and DebugPrivilegesEnabled, because the detection is triggered by privileged access to lsass.exe, not the tool's name.
Impact: ransomware staging its encryption routines raises alerts such as CryptApiUsed while the payload prepares to lock the endpoint's files
Everything the sensor records feeds the Correlation Engine for EDR, which consolidates it into endpoint incidents; with XDR, the same signal is correlated with telemetry from every other sensor in the environment, across all impacted resources. Because this is the surface where an attack's individual steps actually run, it is also where the timeline is most complete.
EDR Detections in Practice
To see these detections on a real attack, open the GravityZone Demo Incident, which breaks a complete ransomware attack chain into per-machine process graphs you can navigate detection by detection.
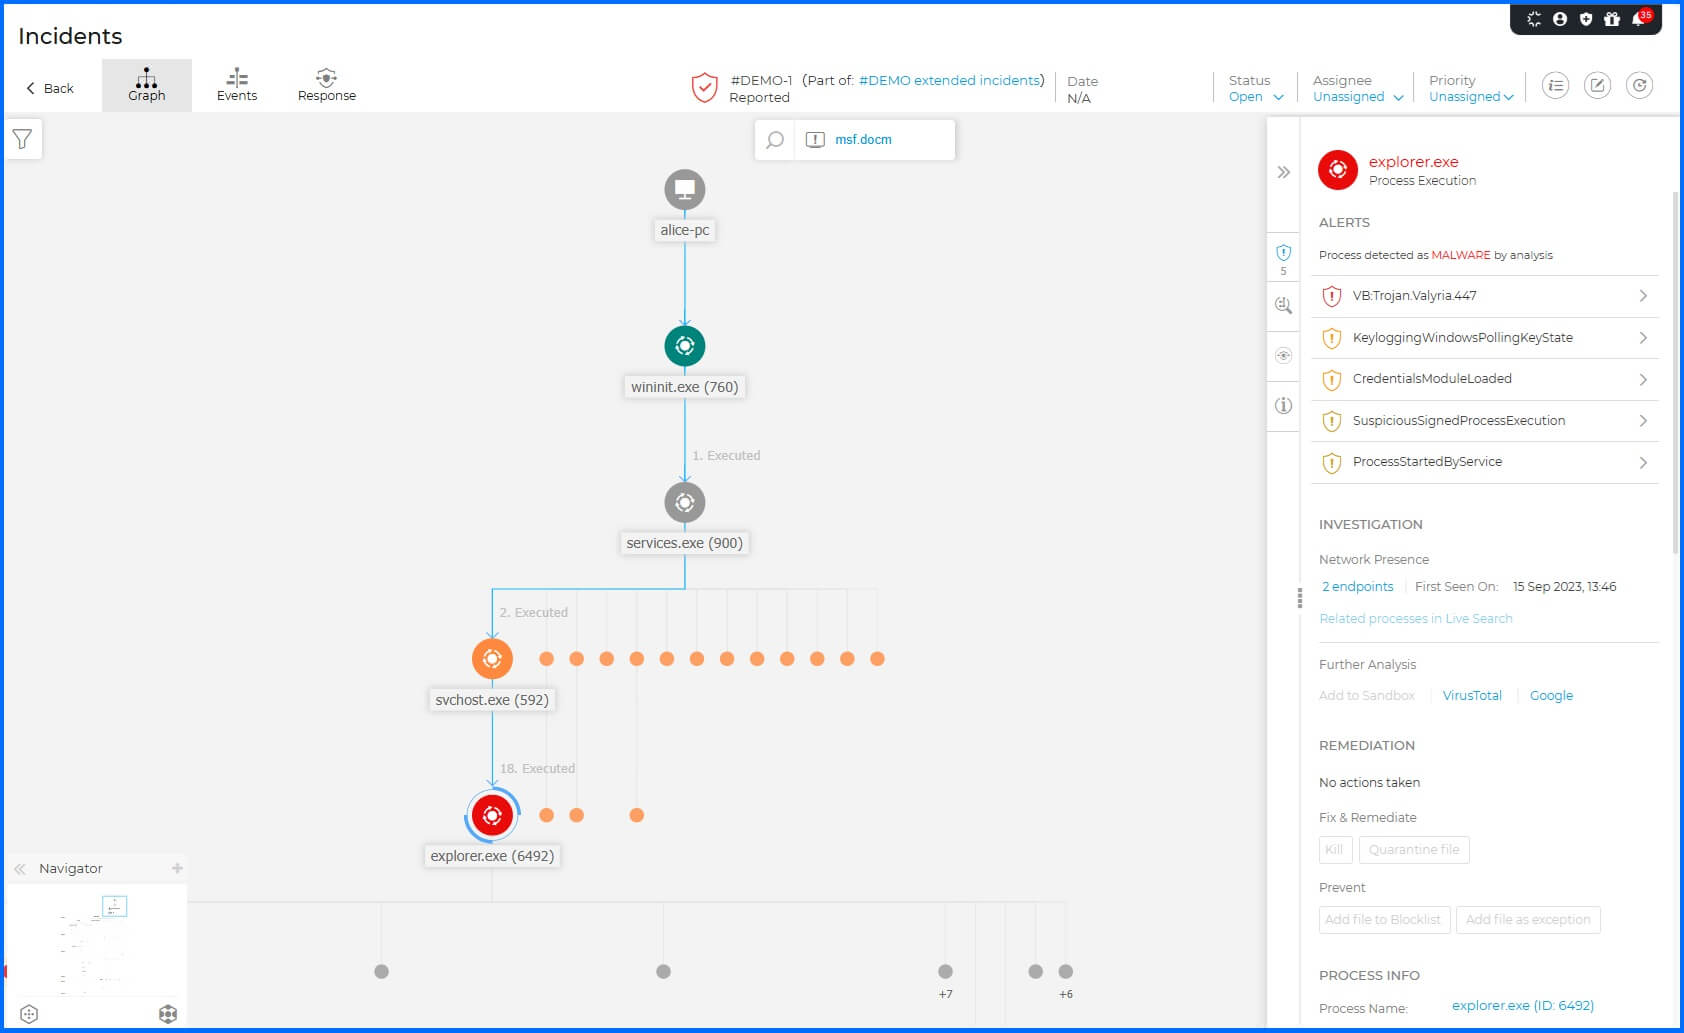 |
On the first compromised workstation, where the user opened the malicious attachment (the User Execution technique), the graph ends in an explorer.exe process marked as malware. Alerts such as KeyloggingWindowsPollingKeyState and CredentialsModuleLoaded flag that credential theft is in progress. The alerts then shift with the attack phase: CryptApiUsed and AccessTokenModified mark ransomware staging on the file server, the NetworkDiscoveryApiUsed alert appears on the CFO's laptop as the attacker maps the next targets, and the Anomaly.User alerts beside them show the per-machine baseline registering the deviation.
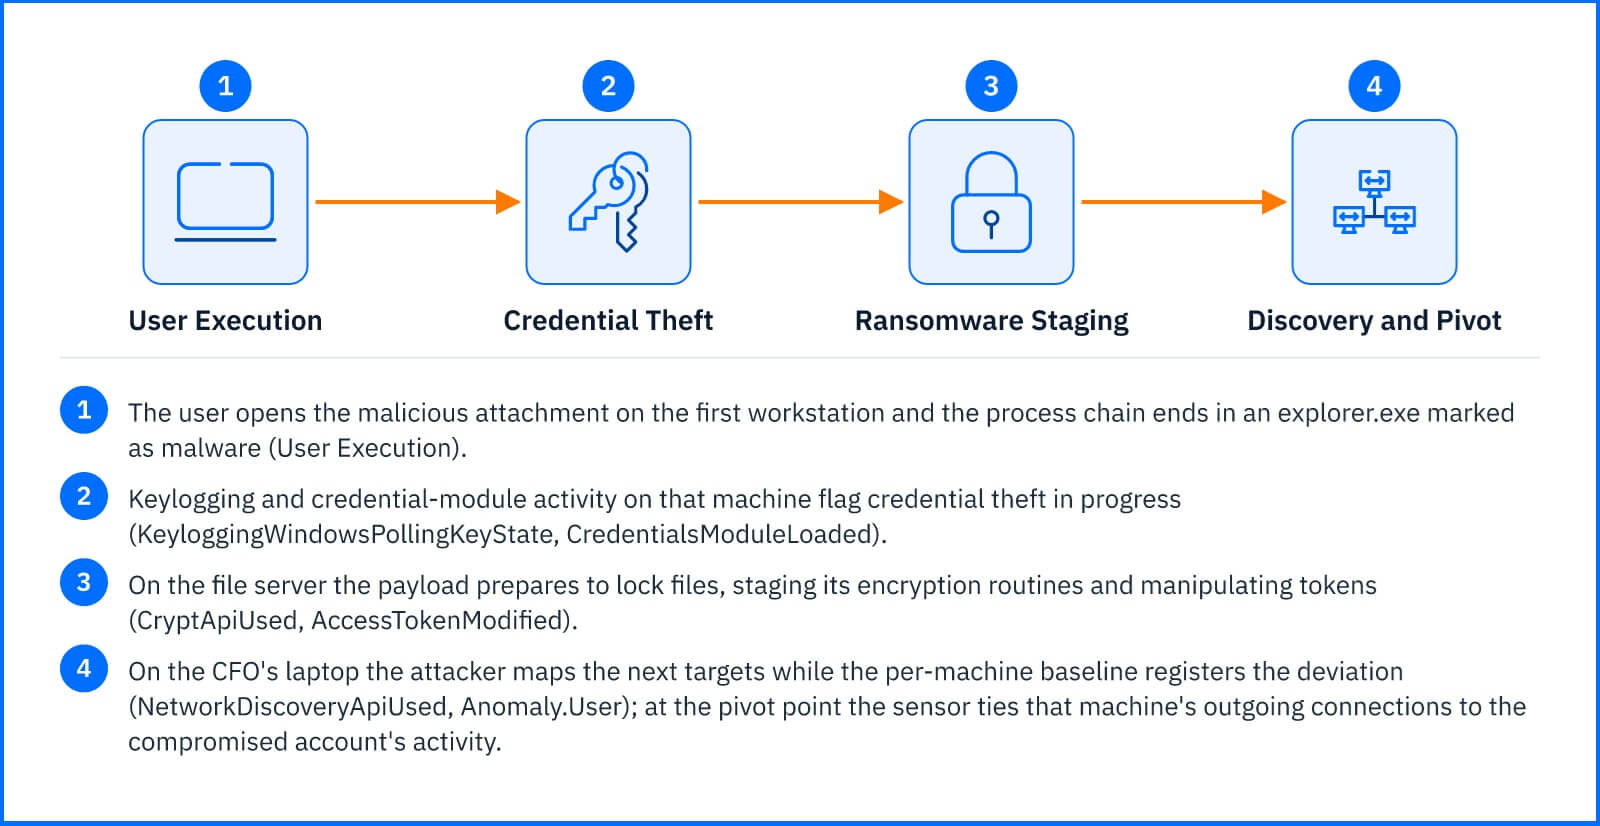 |
Follow the chain to its pivot point, and the Incidents Sensor correlates the outgoing connections from that machine with the compromised account's activity, the link that ties the endpoint's local events to the wider attack the Correlation Engine is assembling.
Deployment and Configuration
If Bitdefender GravityZone endpoint protection is already deployed, enabling the Incidents Sensor is a matter of adding the EDR module to the BEST agent already deployed for endpoint protection. Full installation and configuration steps are in the Bitdefender Support Center articles on EDR installation page.
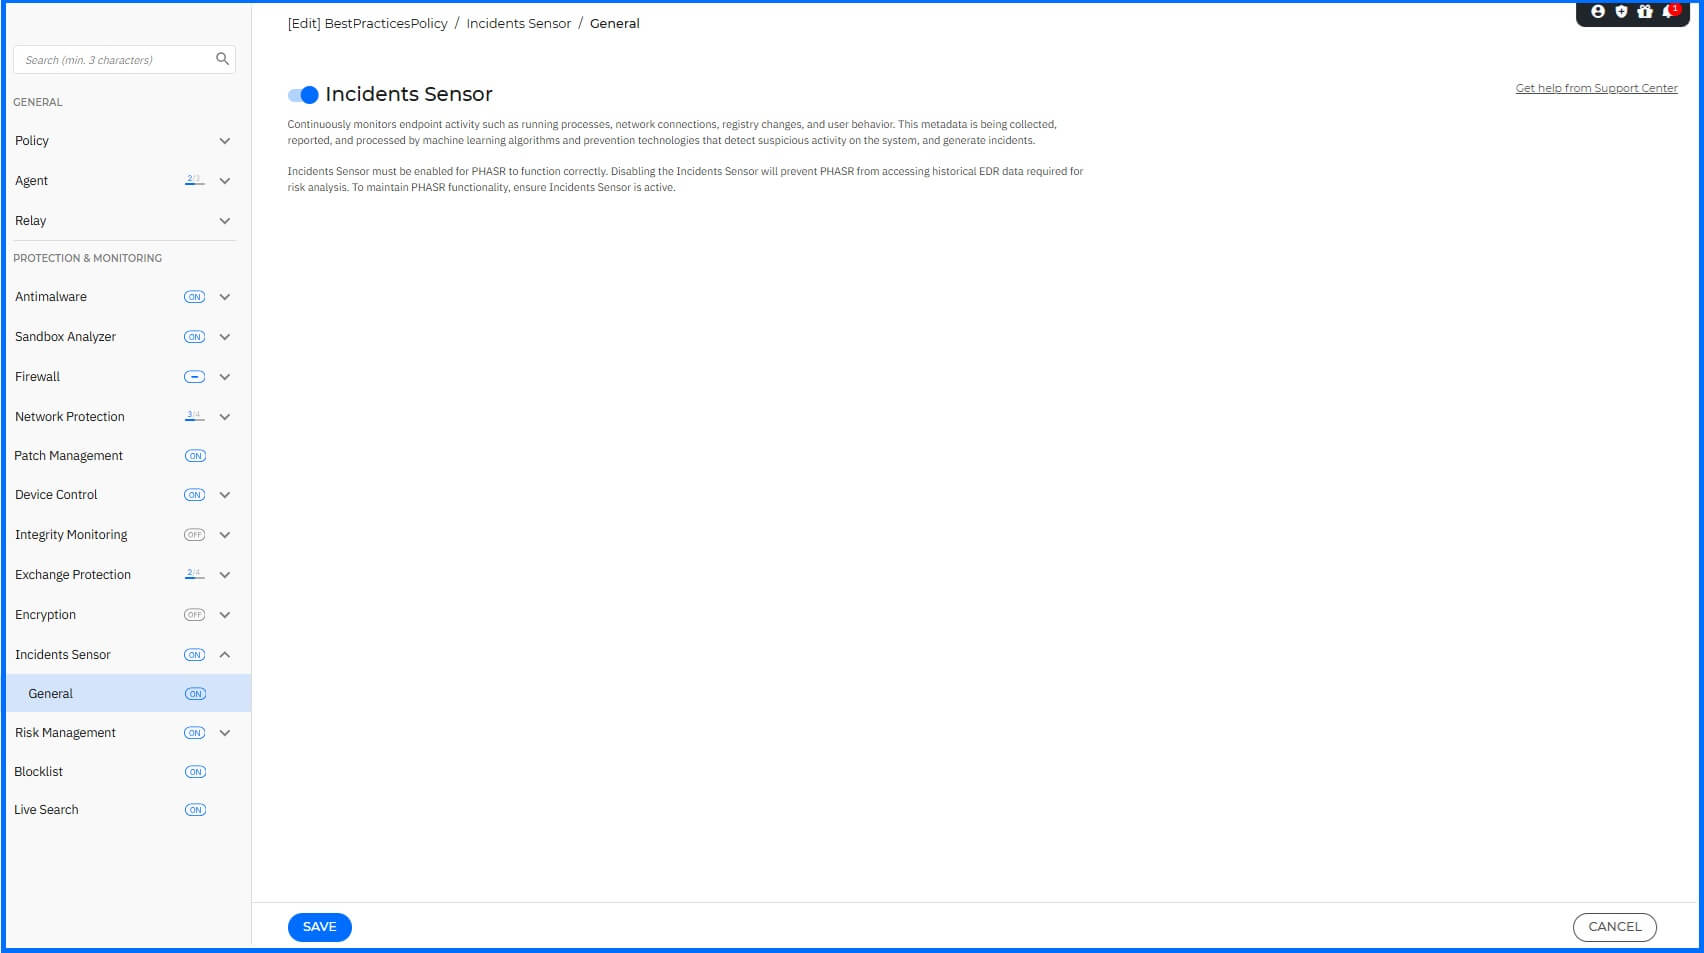
Before you consider turning the sensor off, it's worth knowing that it cuts Proactive Hardening and Attack Surface Reduction (PHASR) off from the data it needs. PHASR requires the Incident Sensor to be enabled, because it relies on EDR data for its risk analysis.
Response Actions
The Incidents Sensor contributes response actions in two modes: automated actions that fire from the sensor's own configuration, and manual actions an analyst runs from within an incident.
The automated actions target the process level: Prevent process execution blocks a process before it starts, and Terminate the running process kills it while it runs. Enabling the EDR response actions option in the Incidents Sensor policy lets EDR apply them automatically to detected malicious processes, prior to or during execution, based on the configured settings and detection logic.
 |
Because the sensor lives on a managed endpoint, the manual actions sit alongside the endpoint protection platform actions available on the same machine, such as isolating the endpoint, collecting an investigation package, or opening a remote shell. The full action table is in the Threat Response article.
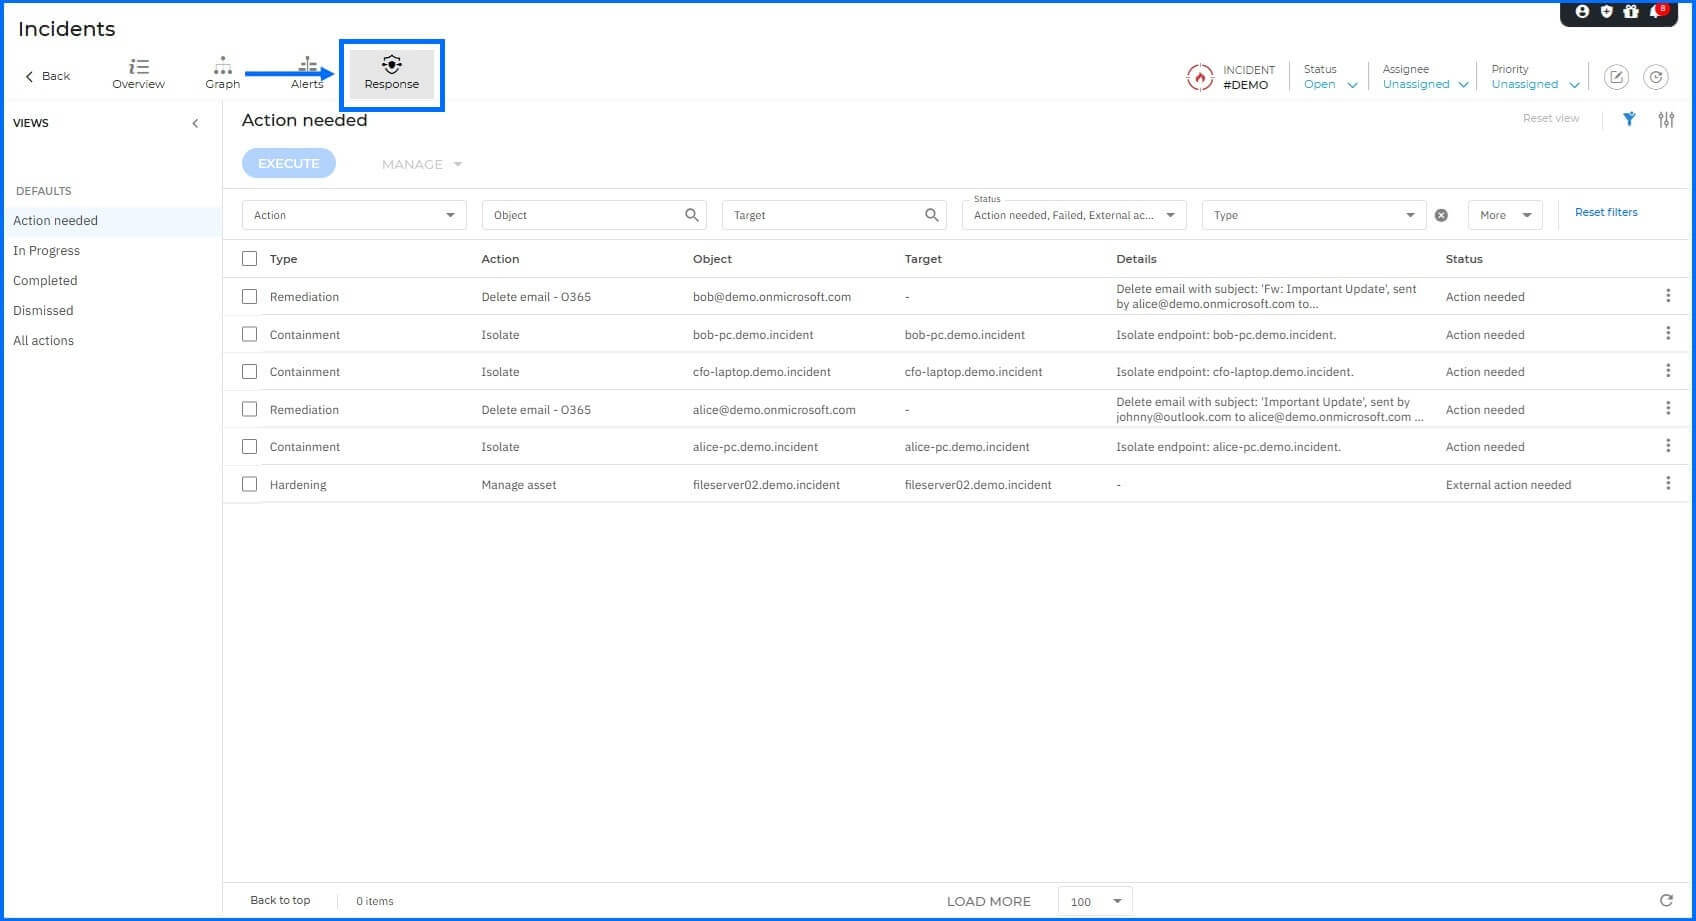 |
Those two modes cover the sensor's built-in detections, but the events it collects have uses beyond that. They are the raw material for custom detection rules, where your own criteria for process, file, or registry activity raise incidents and can trigger automated actions. The same events also power Threat Hunting through Live Search and Historical Search.
Hands-on Scenarios
The following scenarios demonstrate how you can solve specific challenges using the events the Incidents Sensor collects.
Hunting Living off the Land Activity
PowerShell abuse is hard to separate from legitimate administration because the binary itself is trusted, and you need to know what it is actually being used for across the fleet, right now. Use Live Search, which runs osquery against your endpoints in real time, instead of waiting for a detection. Query the processes table for running PowerShell instances with their command lines: SELECT pid, name, path, cmdline FROM processes WHERE name = 'powershell.exe'. Review the returned command lines to separate update scripts from enumeration activity, then pivot on each suspicious process's parent and user to decide where to investigate next.
Recovering Evidence the Attacker Deleted
Cleanup is part of most intrusions, and a file that no longer exists cannot be scanned, leaving a hole in your timeline. The sensor records a file-deletion event that persists after the file is gone, so a Live Search on the edr_file_delete event returns the deleted file's path, the ID of the process that removed it, and the deletion timestamp. For example: SELECT path, pid, date_time FROM edr_file_delete WHERE date_time > (strftime('%s', 'now') - 300) retrieves deletions from the last five minutes. Use the returned paths and process IDs to reconstruct what was removed and by which process.
Containing a Tool That Keeps Coming Back
The same attacker utility reappears under different names, and manually killing it each time loses the race. Use a custom detection rule to turn the sensor's events into automatic containment. Create a rule under Incidents > Custom detection rules that matches the file's SHA256 or its parent command line rather than its name, then enable the rule's automatic actions to kill the process and collect an investigation package the moment it runs again.
Common Mistakes and Misconceptions
"The Incidents Sensor is another name for antivirus"
Prevention modules such as Malware Protection and Advanced Threat Control block what they recognize as malicious, and their job ends at the block. The Incidents Sensor records what happens: process starts, file operations, registry changes, and connections, malicious or not. The Demo Incident makes the distinction visible: it runs with prevention intentionally disabled, and the sensor's telemetry still reconstructs every step, from the explorer.exe process marked as malware to the credential theft alerts that follow. Prevention decides in the moment; the sensor preserves the evidence and feeds the detection logic that works across moments.
"If prevention is on, the sensor can be switched off safely"
Turning the sensor off does not just pause EDR. Its event stream is the raw material for capabilities that have no other source: custom detection rules stop matching, Live Search and Historical Search have nothing new to query, Anomaly Detection loses the per-machine baseline it trains on, and PHASR loses the EDR data its risk analysis requires. Prevention keeps blocking what it recognizes. Without the sensor, anything that gets past prevention and protection is invisible.
"Endpoint visibility shows the whole attack"
The sensor has the highest-resolution view of any surface, but only of its own. In the Demo Incident, the initial phishing email is visible to the Office 365 Sensor, the Kerberos brute force to the Active Directory Sensor, and the command-and-control traffic to the Network Sensor. The Incidents Sensor sees the pivot machine's outgoing connections; identifying the phishing email as the root entry point takes the Correlation Engine for XDR combining all four. Endpoint events anchor the timeline. They do not contain it.