Security Data Lake – Bitdefender TechZone
GravityZone integrates Security Data Lake to combine SIEM operations with scalable storage, neutralizing data silos. This architecture utilizes Sigma Rules and Illuminate Packs to correlate telemetry across firewalls, cloud, and endpoints for accelerated MTTD.
Across your organization's infrastructure, all devices like firewalls, servers, endpoints, applications (e.g., BEST agent), and cloud services are constantly generating their own unique telemetry, often in different formats (log, txt, JSON, csv, etc.) and sizes. This volume of data creates a critical operational challenge: it is impossible to manually parse, search, or effectively correlate security events across platforms. The result is the creation of data silos, preventing you from gaining the unified, cross-platform visibility necessary to detect advanced threats.
To overcome this challenge, you need a single data processing engine that can act as a centralized Security Information and Event Management (SIEM) with Data Lake, one that transforms raw, fragmented logs into actionable security intelligence and makes cross-platform correlation and historical analysis possible.
Security Data Lake
Bitdefender GravityZone Security Data Lake brings together SIEM operations with scalable Data Lake storage and advanced analytics. This combination collects, correlates, and retains data from diverse company resources - including network devices, operating systems, applications, and cloud services - leveraging SIEM functionality and analytics for proactive threat hunting. This enriched data allows you to understand issues, run investigations, determine the root cause, and execute remediation actions, accelerating your Mean Time to Detect (MTTD) and Mean Time to Respond (MTTR).
Security Data Lake can be used by security services like Bitdefender Managed Detection and Response (MDR) to enrich Bitdefender logs by adding information from your cloud services, firewalls, and other critical infrastructure. This provides a more comprehensive view of your threat landscape and significantly enriches their investigations.
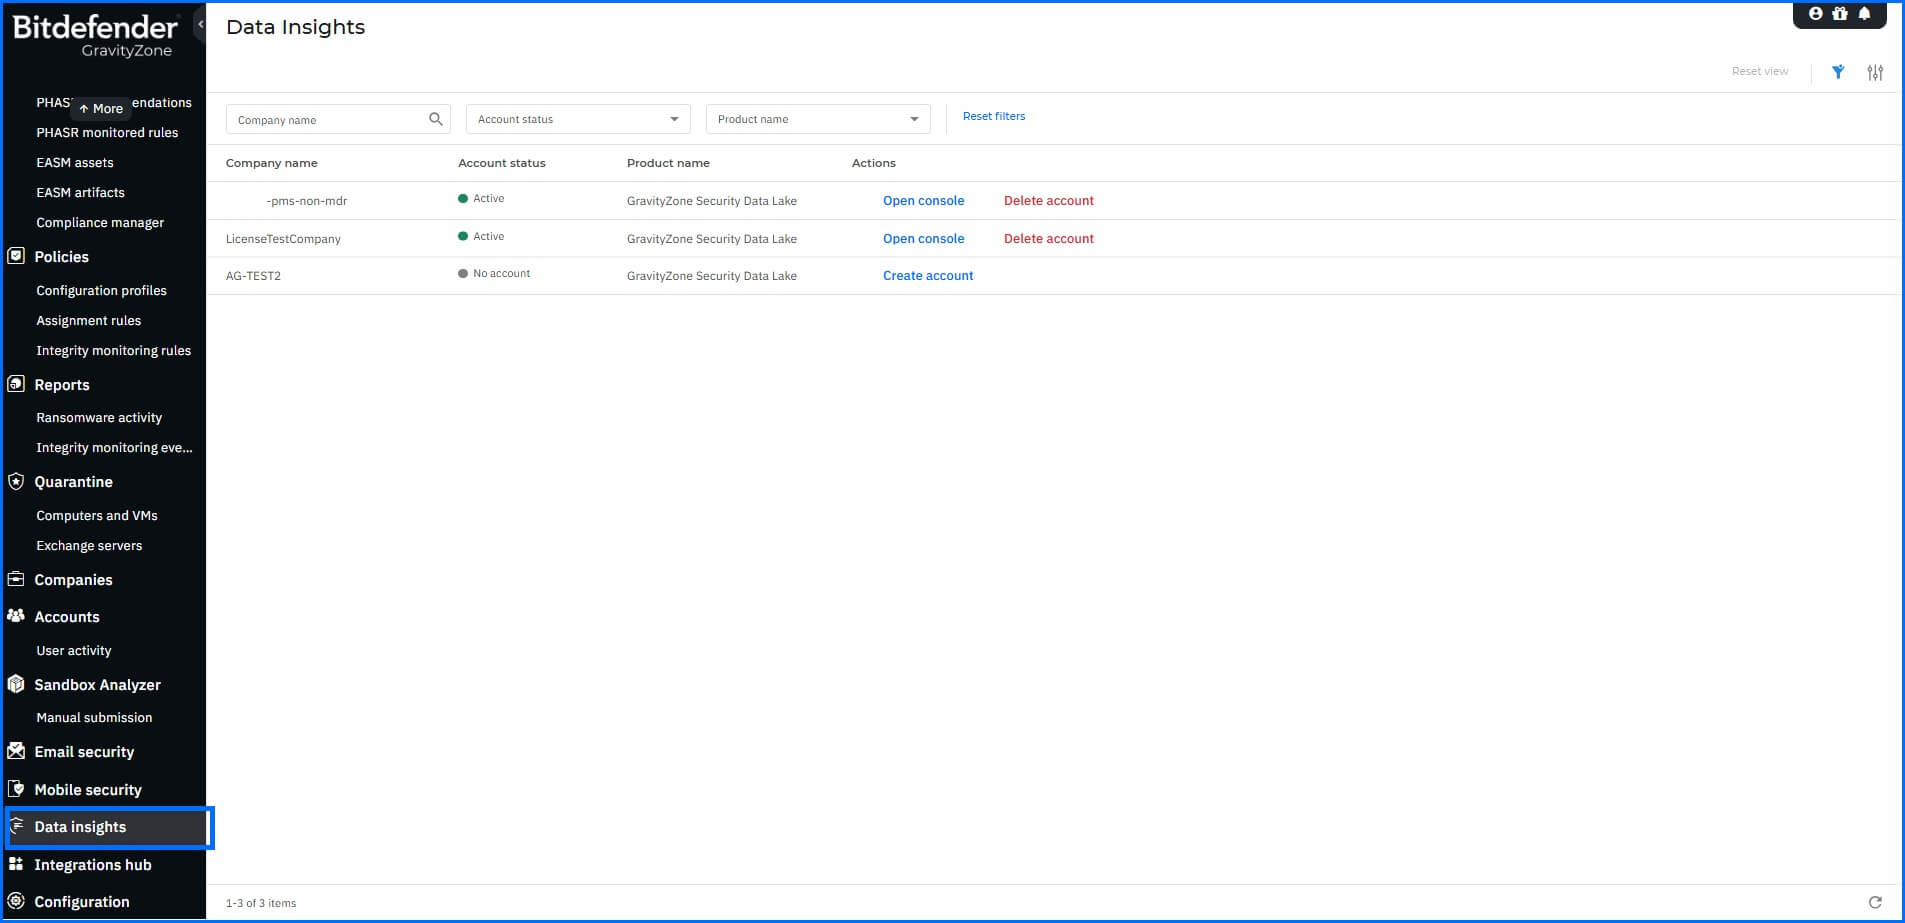
The management interface is available from the GravityZone Console in the Data Insights section of the main menu tree. Access is simplified through the Bitdefender single sign-on (SSO) system, allowing you to seamlessly switch between consoles using a single, secure authentication.
 |
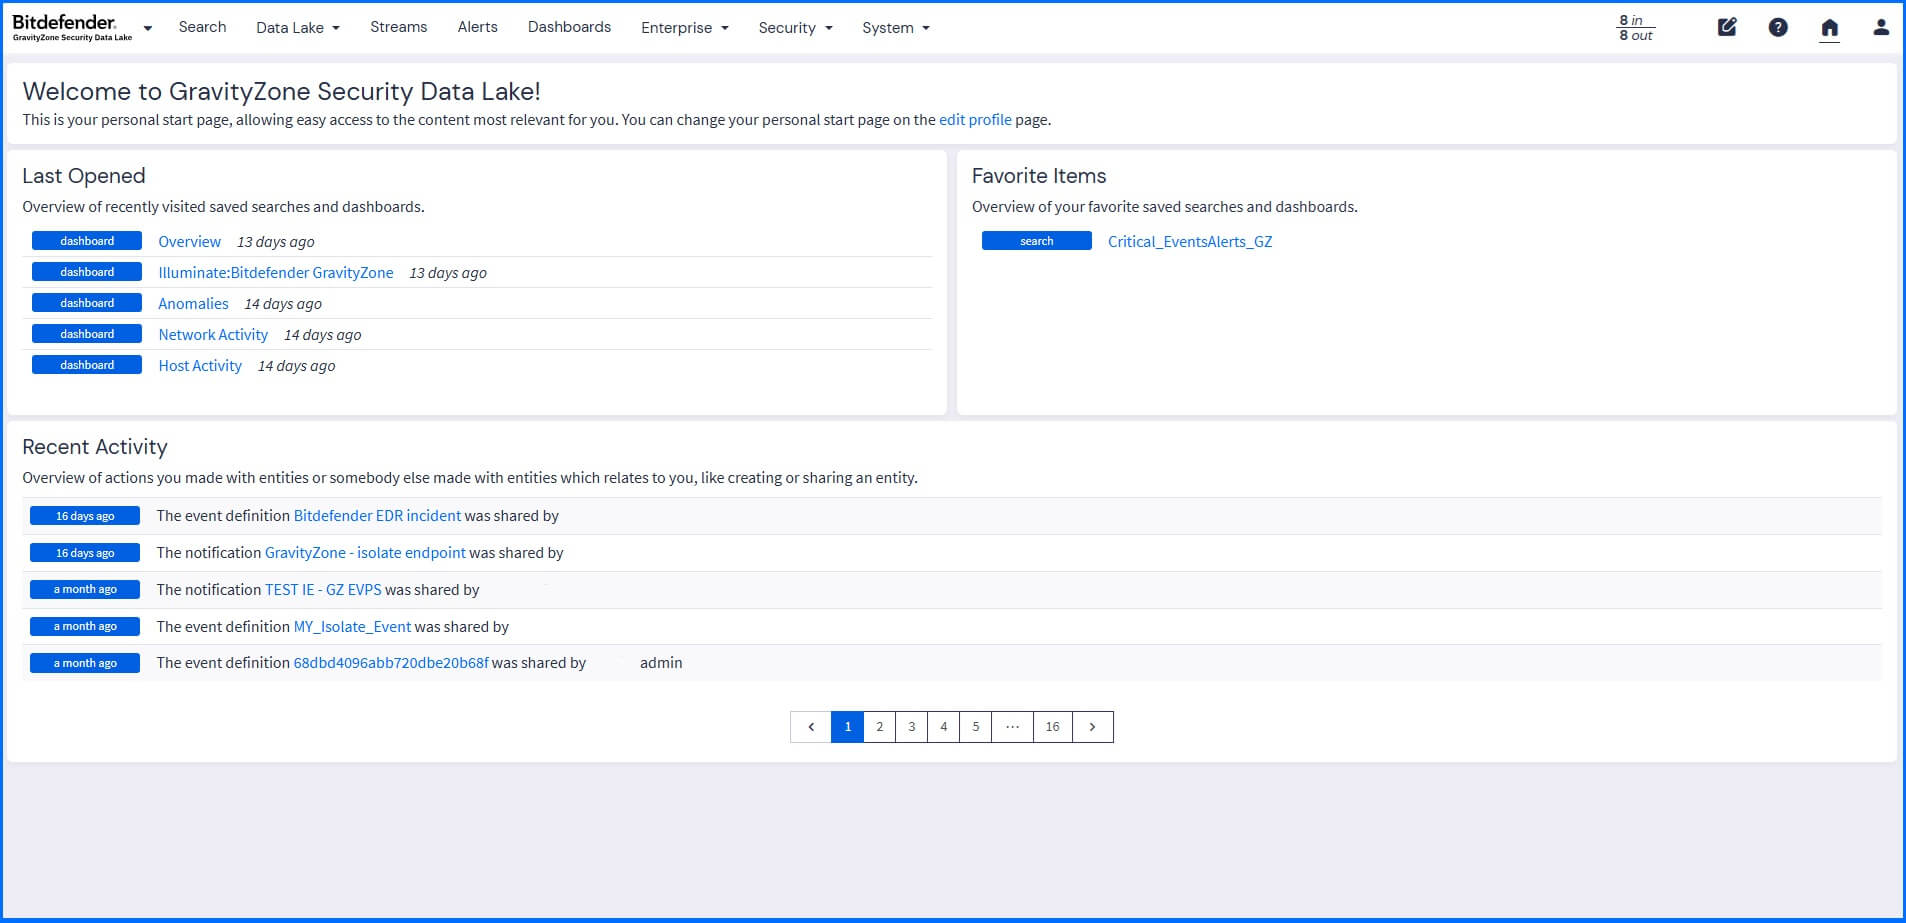
By default, you access the home page view, with a welcome screen containing information about content you have used recently, recent activity made by you or another user related to your entities, and your saved favorite items, such as the dashboard or saved searches.
 |
Security Data Lake provides you with two log view perspectives: General and Security views. The general view (available by default) provides you with the ability to search data, identify and monitor events, configure alerts, notifications, and use the correlation engine to analyze sequences of events. Security view (available from the top-left side of the main menu) provides enriched context by risk-based insights and behavioral analysis to help your security team detect, investigate, and prioritize threats.
Data Processing and Indexing
The Security Data Lake transforms data by collecting it from your assets, processing the raw data, and indexing it, creating a searchable format ready for dashboards and reports. Data is collected into a dedicated cluster, to ensure full data isolation and dedicated resources for your organization.
Data Collection
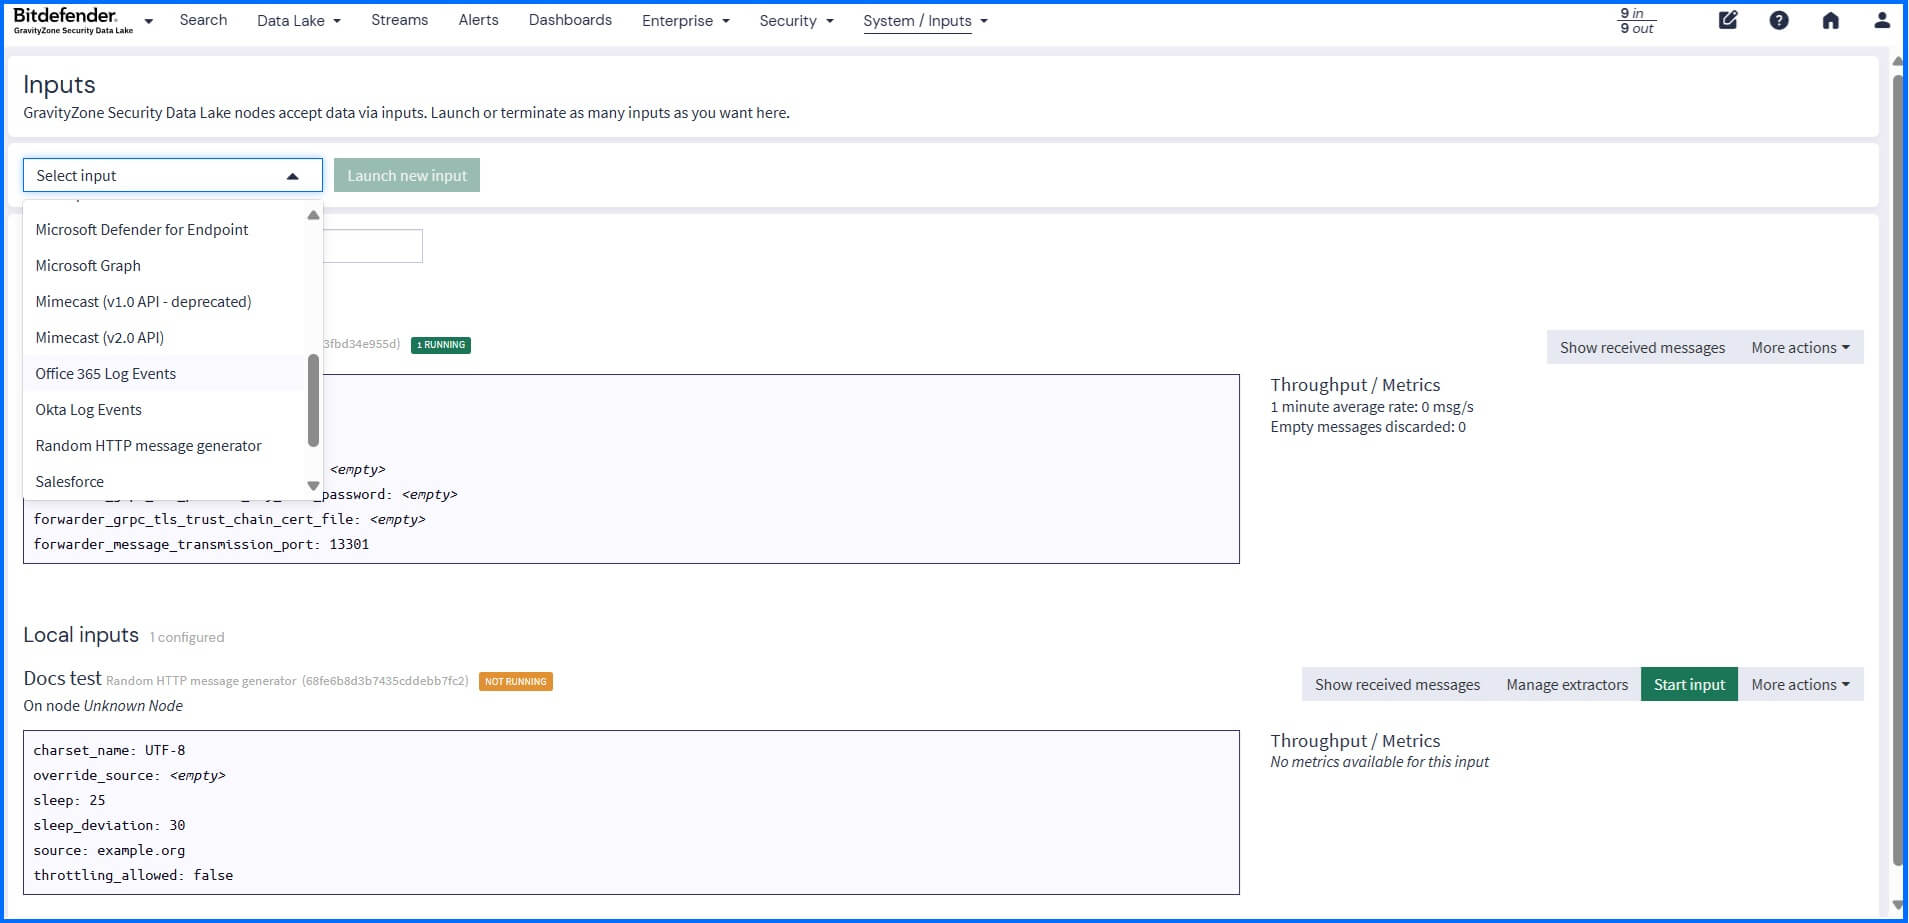
The GravityZone Security Data Lake accepts data via Inputs that you can configure under System > Inputs. All data sources, including telemetry from GravityZone, require manual configuration.
Each input type is designed to handle specific data formats or communication methods, allowing it to receive logs from all your network devices, operating systems, applications and cloud. For example, Bitdefender GravityZone Input supports collecting logs published from Bitdefender GravityZone using the Event Push service.
 |
Security Data Lake supports inputs from:
Firewalls: Palo Alto Networks, Check Point, Cisco ASA, Fortinet, Juniper, SonicWall, pfSense.
Cloud/services: AWS Kinesis/CloudWatch, AWS S3, AWS Security Lake, GCP Log Event, Office 365 Log Events, Okta Log Events.
Structured Log Formats: CEF AMQP, CEF Kafka, CEF TCP, CEF-UDP, GELF AMQP, GELF HTTP, GELF Kafka, GELF TCP, GELF UDP, Open Telemetry (gRPC), JSON path value from HTTP API.
Agents: Beats, Beats Kafka.
Network: IPFIX UDP, NetFlow UDP.
Standard logs: Syslog AMQP, Syslog Kafka, Syslog TCP, Syslog UDP.
Plain Text Formats: Raw HTTP, Raw/Plaintext AMQP, Raw/Plaintext Kafka, Raw/Plaintext TCP, Raw/Plaintext UDP.
Through support for Standard logs and Plain Text Formats, the Security Data Lake allows for collecting logs from almost all products if they generate logs.
Before configuring the Input, define your use cases and the necessary log types to support them, prioritizing specific collection over ingesting all logs.
Detailed information about Inputs configuration can be found at our Bitdefender Support Center here.
Data Processing
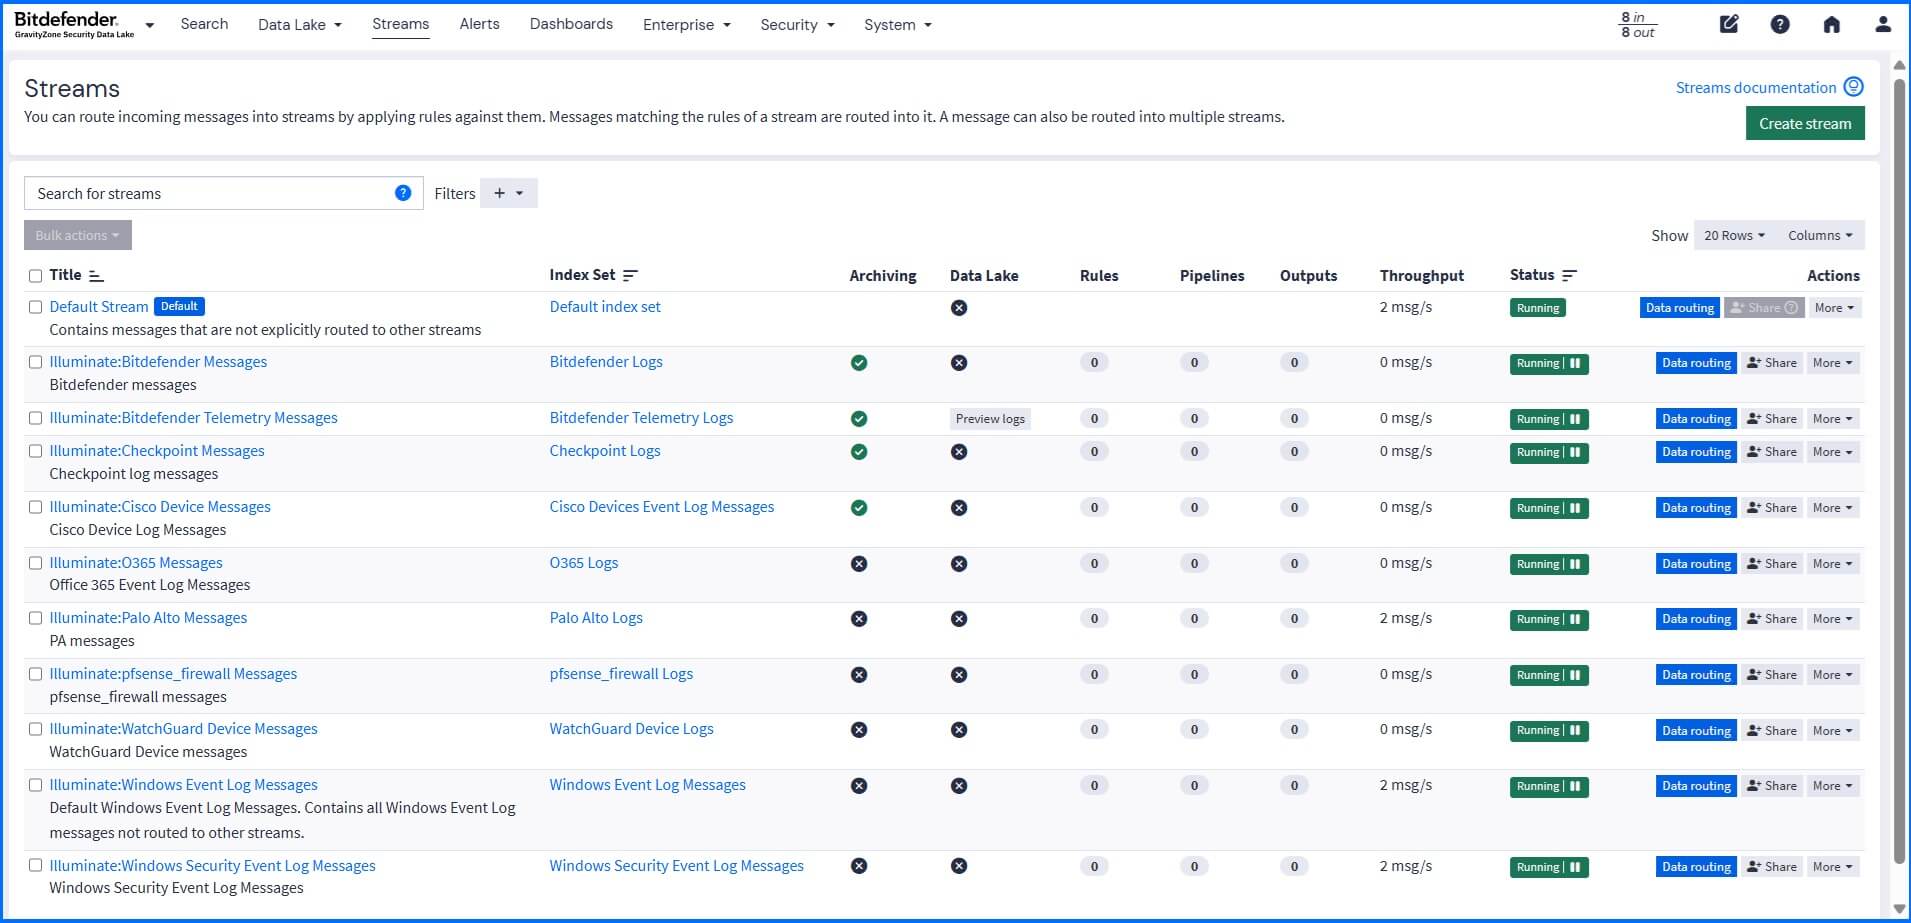
Logs from Inputs are filtered in real-time by Streams based on criteria such as message source, severity, content, or other specific conditions. Streams are automatically created when you install Illuminate Packs (described below). You can also build your own custom Streams in the Streams section. If an Input does not match any Stream rules, it is sent to the Default Stream. It is the only Stream that cannot be stopped or modified.
Detailed information about Streams configuration can be found at our Bitdefender Support Center here.
 |
Pipelines available in the System > Pipelines section let you transform and process messages coming from streams. A Pipeline is a series of stages containing rules that are executed sequentially, allowing you to modify, enrich, or drop log messages before they are indexed. You can use this functionality for building custom parsers to handle unique or complex log formats. For example, you can use a Pipeline rule to automatically detect the IP address in a raw log message, use a lookup table to determine the associated geolocation, and add this enriched geolocation data as a new field to the log message.
Detailed information about Pipelines configuration can be found at our Bitdefender Support Center here.
To illustrate the data flow, consider a security event from a custom application where the Input accepts a raw text log: [2025-10-28 10:00:00] User 'jsmith' failed login from IP 192.168.1.100. A custom Stream named "Failed Logins" is configured to only match logs where the message contains the string "failed login". A custom Pipeline then executes the rule to extract the IP address (192.168.1.100) and uses a lookup table to determine the associated geolocation for the IP, inserting enriched fields as new, searchable data points: user_geolocation: "New York"
Search Log Data
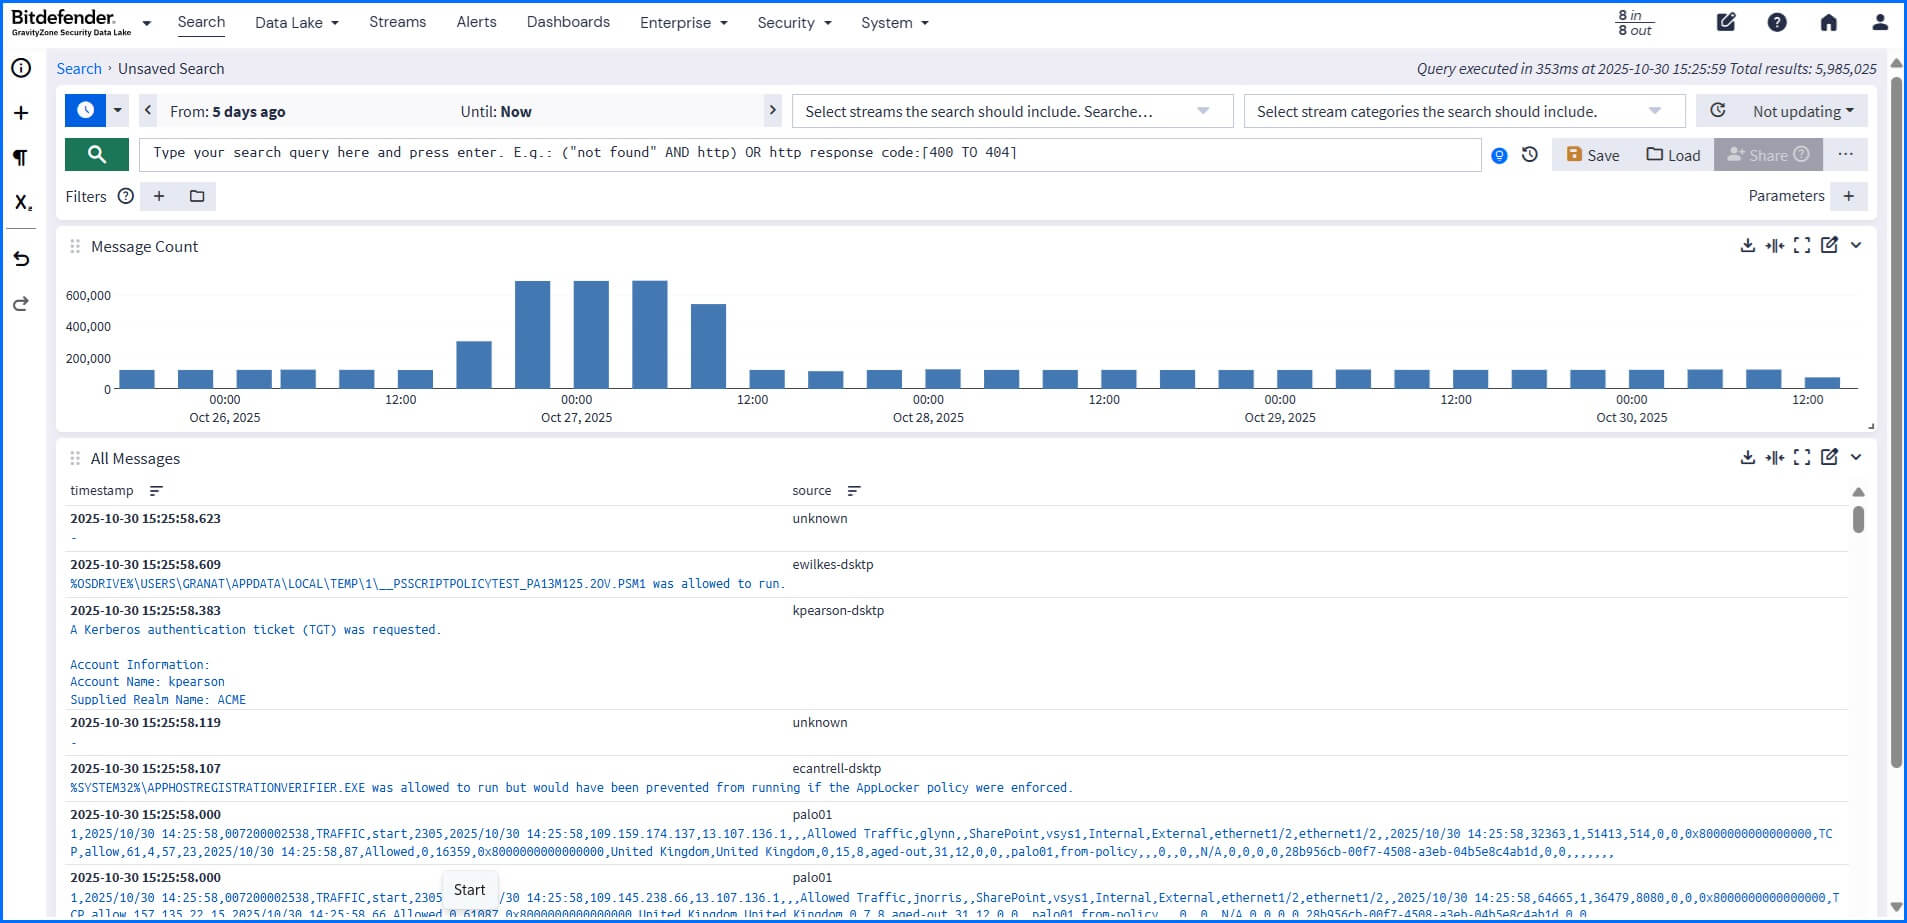
The Search section lets you build complex queries and mix filter criteria to help you find specific log messages. Any search can be saved or exported as a dashboard widget, allowing for easy reuse of specific search configurations and sharing them with other team members.
For complex search queries that require defining a value multiple times, you can use Parameters. Parameters allow the usage of a placeholder that can be used as many times as needed and can be easily updated in saved searches, dashboards, or directly on the main search page. You can define parameters in the sidebar section by selecting Parameter.
You can start your search in selected or all your streams. Search query examples can be found at our Bitdefender Support Center here. Additionally, you can add filters using a query to drill into the data. For example, when searching within Bitdefender Telemetry Messages, you can create filters to query only logs for a specific host or process.
 |
Filters can be saved separately and reused in saved searches and dashboards. Updating a saved filter will automatically affect the search results of searches that include the filter.
Illuminate Packs
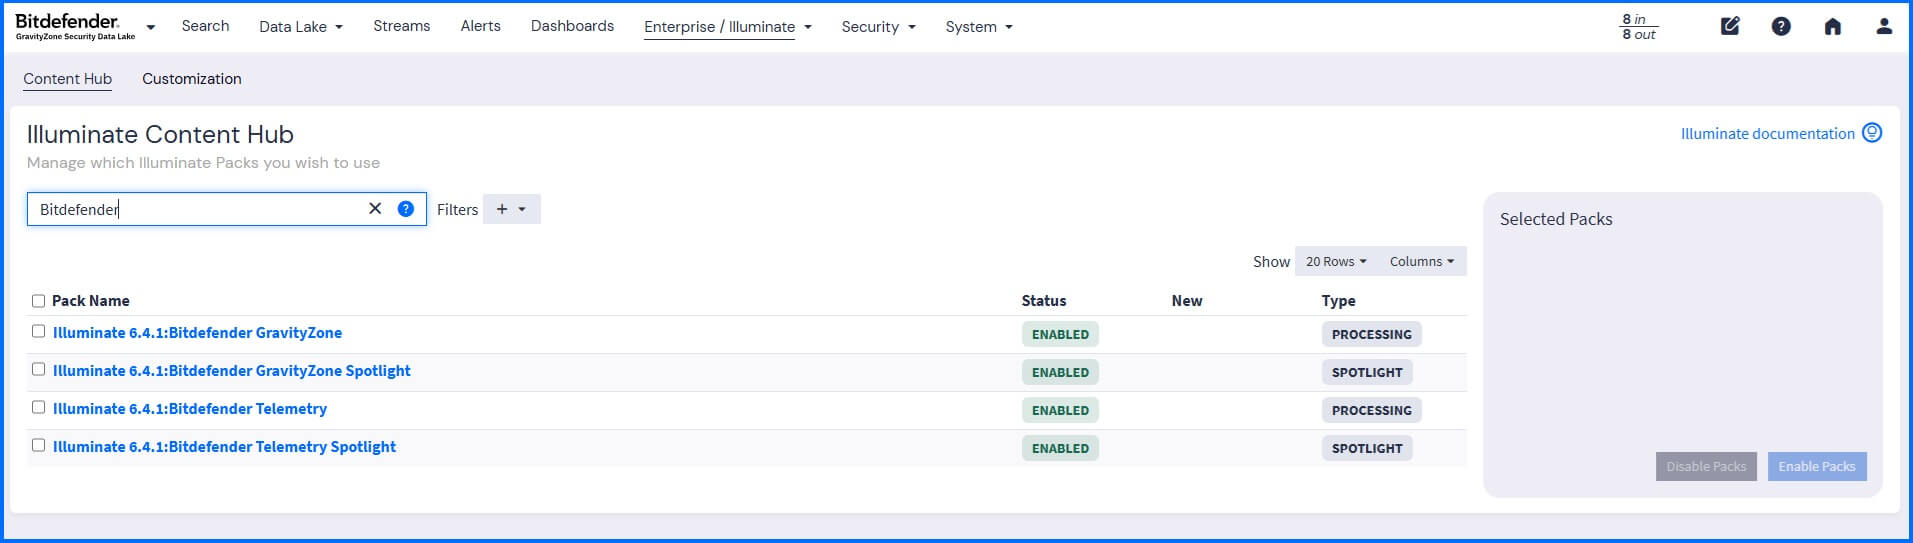
The Security Data Lake is delivered out-of-the-box with Illuminate Packs, which enrich log data with ready-to-use content packs, parsing rules, lookup tables for data normalization, event definitions, and dashboards.
To benefit from the security features provided by Illuminate Packs, activate those related to the Bitdefender GravityZone platform such as Bitdefender GravityZone and Bitdefender Telemetry.
 |
When you are collecting logs from multiple resources, such as operating systems of your endpoints and firewall logs, we recommend activating the following packs:
Core: Anomaly Detection Add-on to add product-specific anomaly detection rules that indicate a specific type of event has occurred (such as a failed login). Anomaly detection allows you to receive events whenever something deviates from its usual behavior or operates outside normal levels.
Event Definitions Rollup to add integrated event detection and monitoring definitions that give you the capabilities to identify suspicious behaviors.
Compliance Content Spotlight to add targeted visibility into Identification and Authentication (IAC), Network (NET), and Endpoint (END) events that support control requirements shared across NIST SP 800-53 Rev 5, PCI DSS v4.0, and US CMMC 2.0 Level 1.
Detailed information about Illuminate packs can be found at our Bitdefender Support Center here.
Events and Alerts
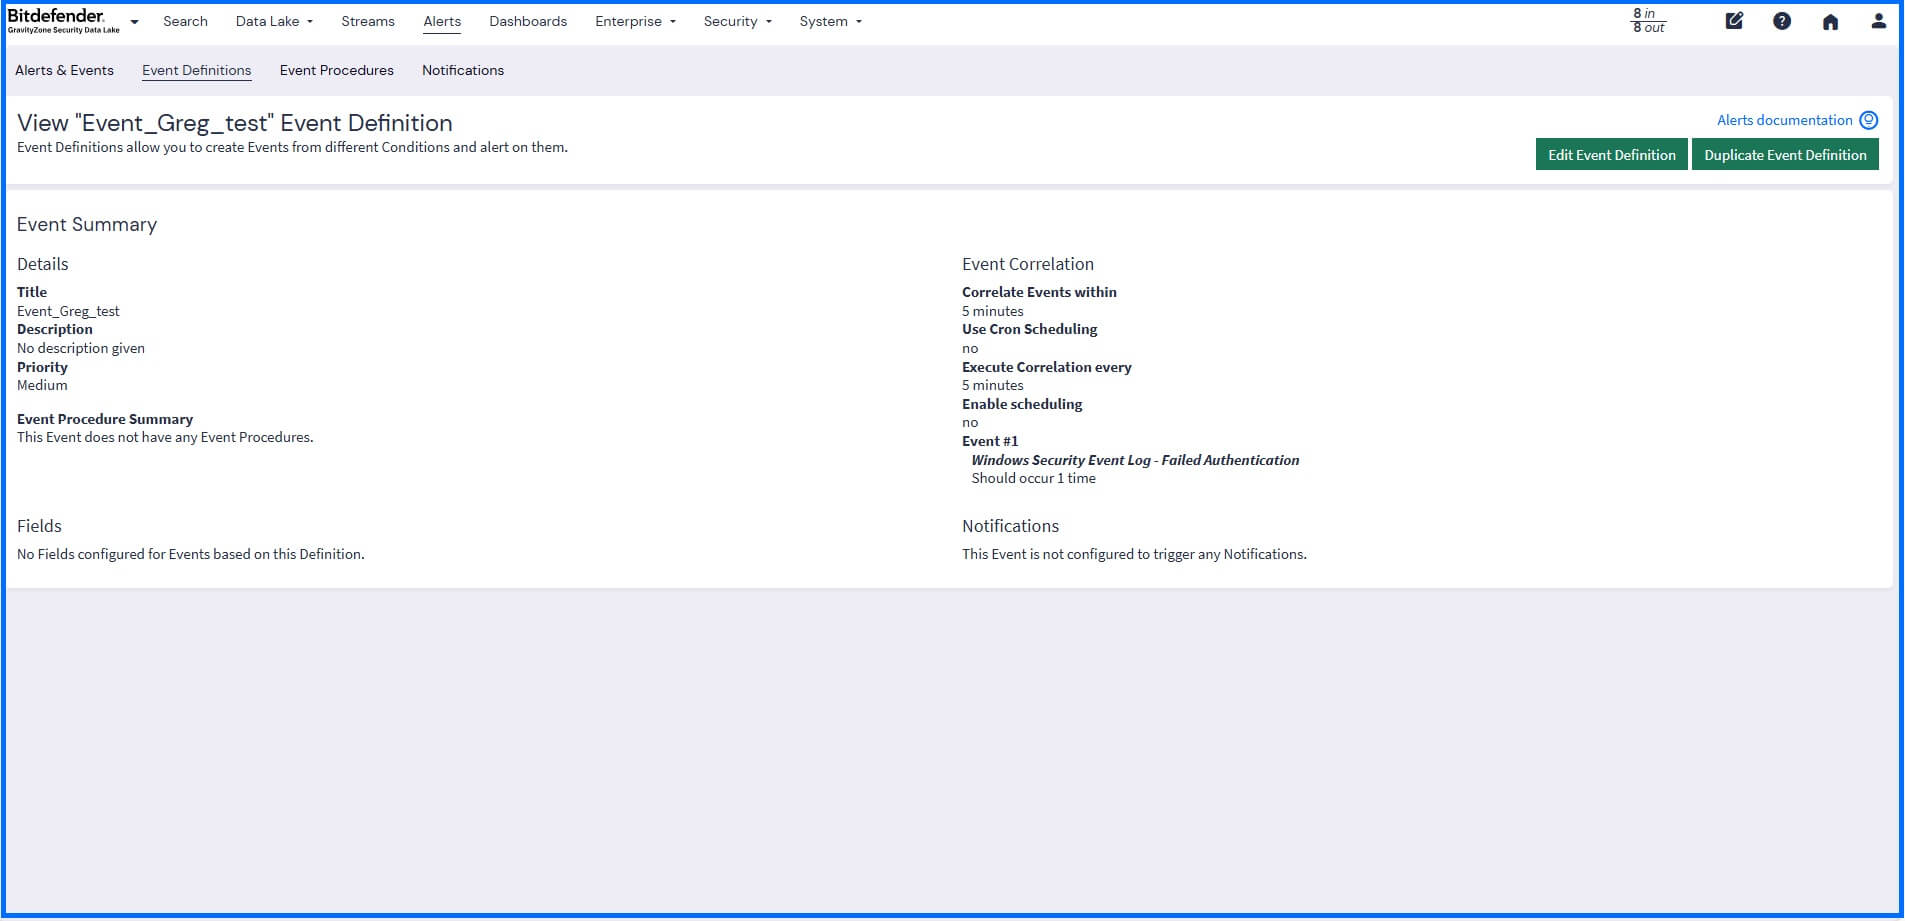
Events are defined by criteria that automatically process and examine incoming logs for specific security conditions. These criteria are sourced from built-in rules provided by Illuminate Packs and rules you custom-define.
You can create your own event definition criteria in the Alerts > Event Definitions section through the wizard or directly from search results.
 |
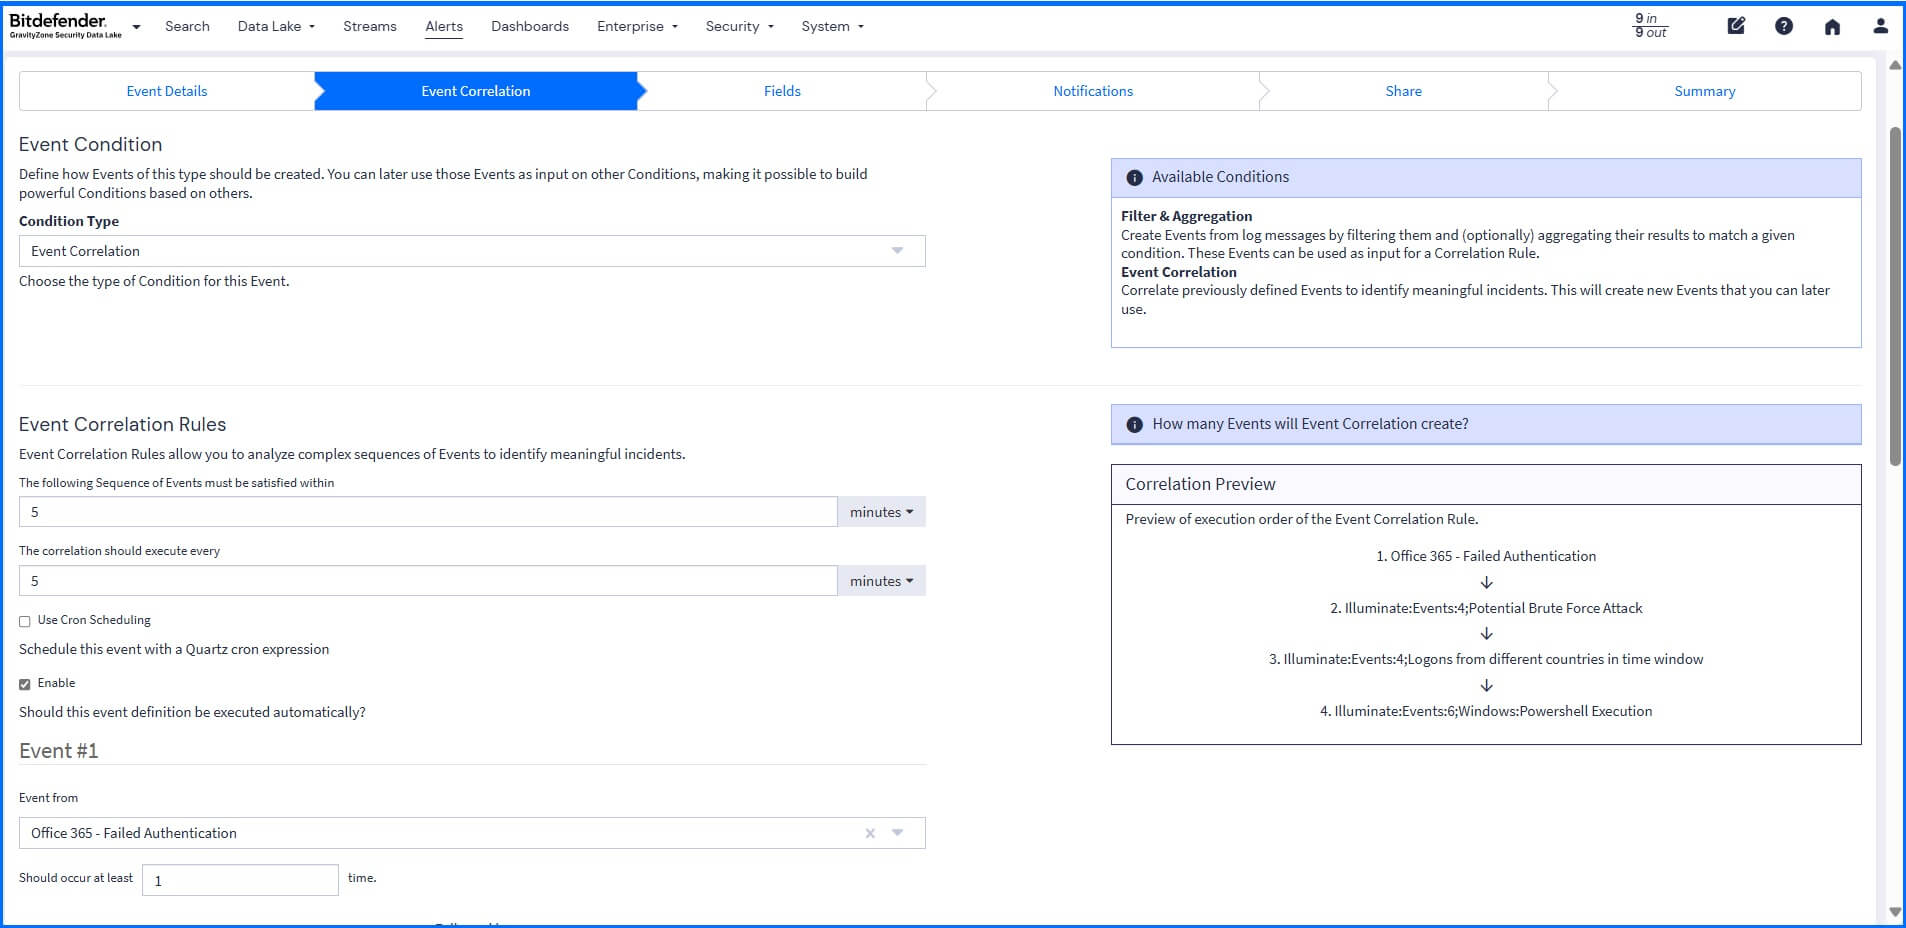
When creating your own event rule, you can use the correlation engine to analyze complex sequences of events. For example, it can correlate a failed login on one server followed by a successful login from a different country to trigger an alert. It connects the dots between isolated events to build complete threat detection.
 |
Once a security event is identified, the system triggers a Notification to ensure immediate action. Notifications alert you of any configured event when they occur and can be sent directly to you or integrated into other systems like Slack, Microsoft Teams, and PagerDuty to put critical alerts into the Incident Response system. You can also configure an HTTP API notification to trigger API calls when an event is generated. This can be used to generate automated responses, such as isolating an endpoint or adding it to a quarantine list on your firewall.
For detailed, contextual alerts, you can include metadata from the event definition, the event itself, and the event's backlog messages (if configured to retain a backlog) when creating the notification.
Detailed information about events, alerts, and the correlation engine can be found at our Bitdefender Support Center here.
Dashboards
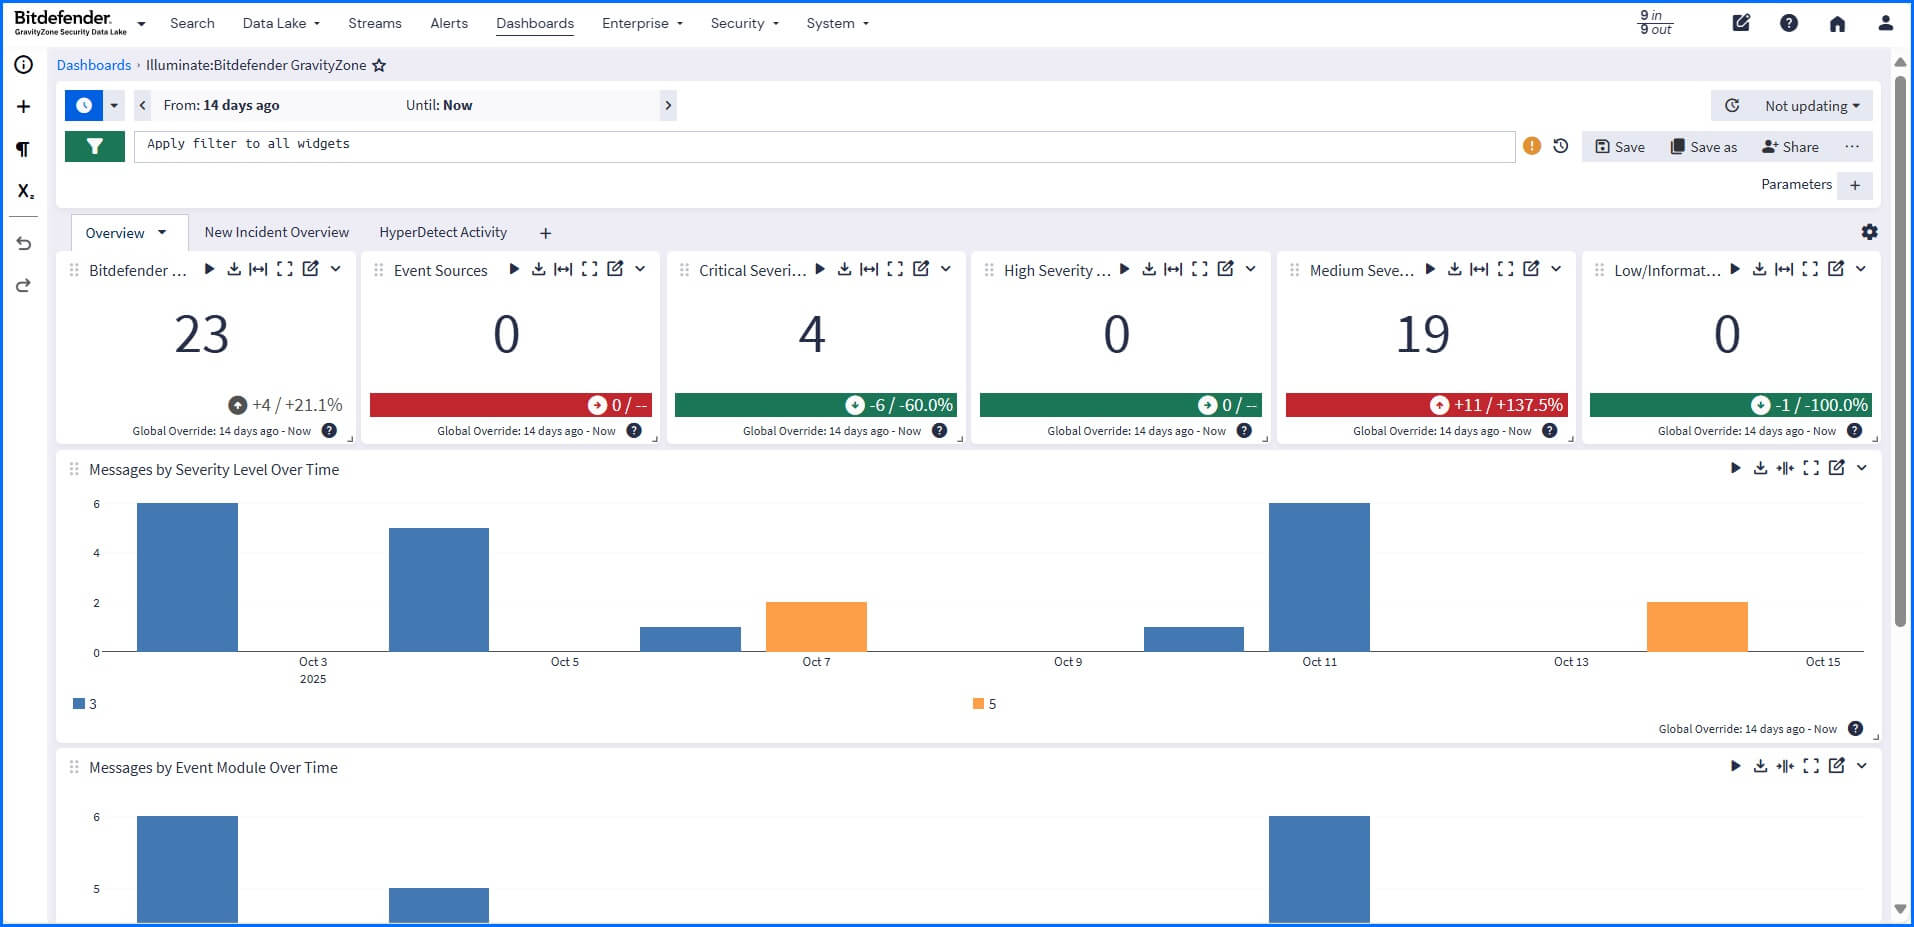
A dashboard is a customizable visual, built from widgets, that displays real-time or historical data, allowing you to monitor, analyze, and visualize key metrics in one centralized location. Illuminate Packs provide default dashboards, such as the Illuminate:Bitdefender GravityZone dashboard, and custom dashboards can be created in the Dashboard section.
 |
Detailed information about dashboards can be found at our Bitdefender Support Center here.
Security Interface View
The Security Overview default dashboard presents information through widgets and provides you with a comprehensive overview of your active investigations, assets, events, system alerts, and threat coverage. You can switch to the Security view on the top-left side of the main menu.
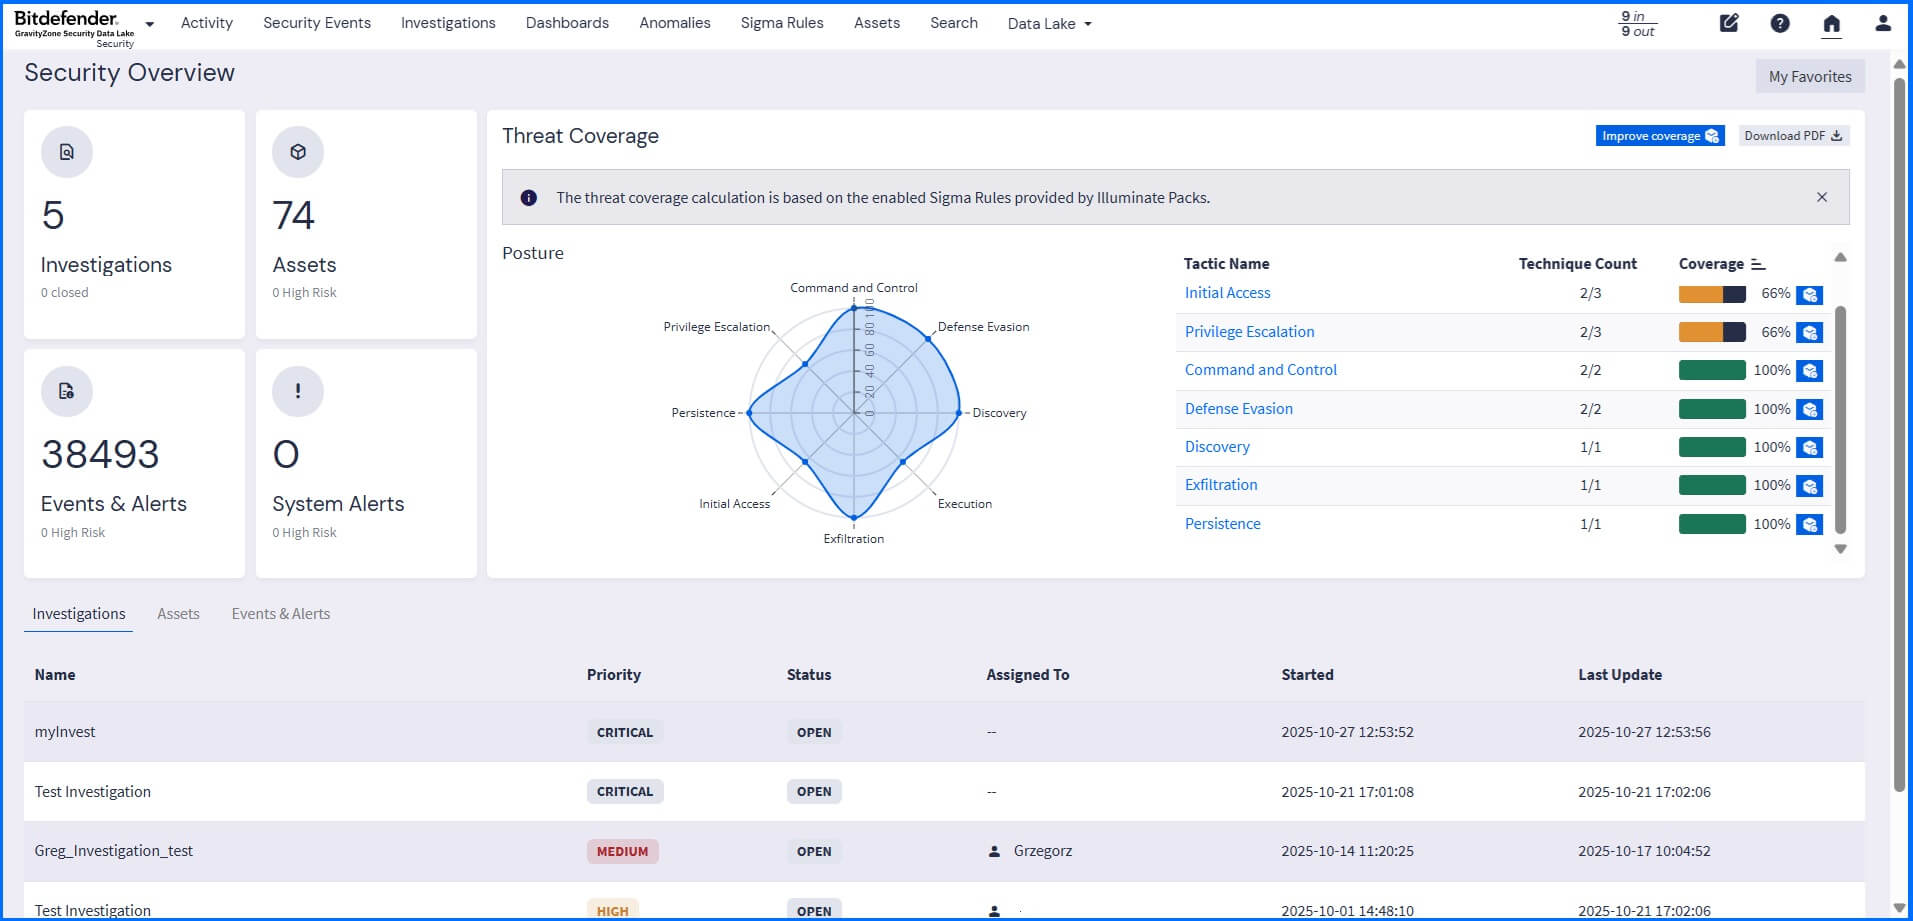 |
The threat coverage section displays the results of Sigma Rules applied to collected logs. All the rules are mapped and grouped to the tactics and techniques listed in the MITRE ATT&CK Matrix. The overall coverage is calculated based on all defined Sigma Rules, active, and inactive. To increase detection coverage, any inactive rule can be activated.
Detailed information about the security interface view can be found at our Bitdefender Support Center here.
Sigma Rules
Sigma rules are a generic, open-source signature format written in YAML that allows you to describe security detection logic in a standardized, vendor-agnostic way. You can install predefined rules using Illuminate Packs, you can create your own rules, or you can upload rules, for example, from the official GitHub repository here.
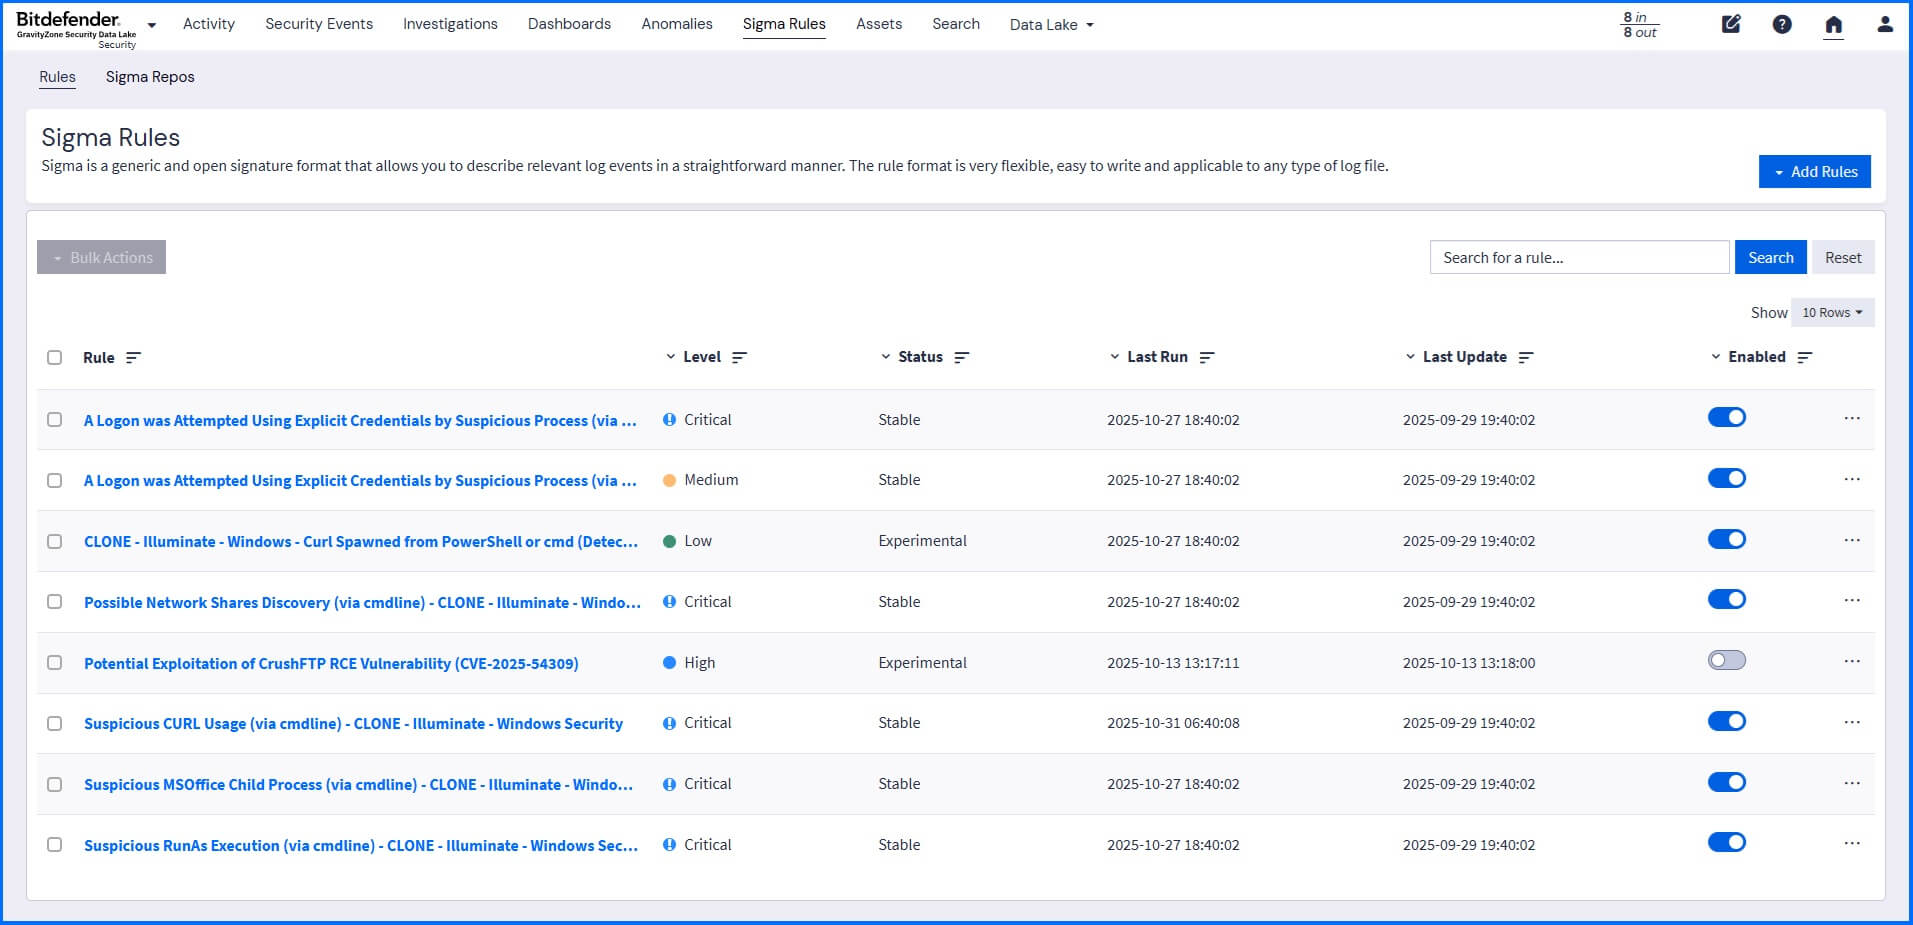 |
This allows you to use security detection rules that focus on adversary behavior, threat hunting rules intended as an analyst starting point, and emerging threat rules, which cover timely threats such as zero-day exploits and active APT campaigns. Make sure to review all the imported rules to ensure that defined field names match field names in your environment.
Detailed information about sigma rules can be found at our Bitdefender Support Center here.
Assets
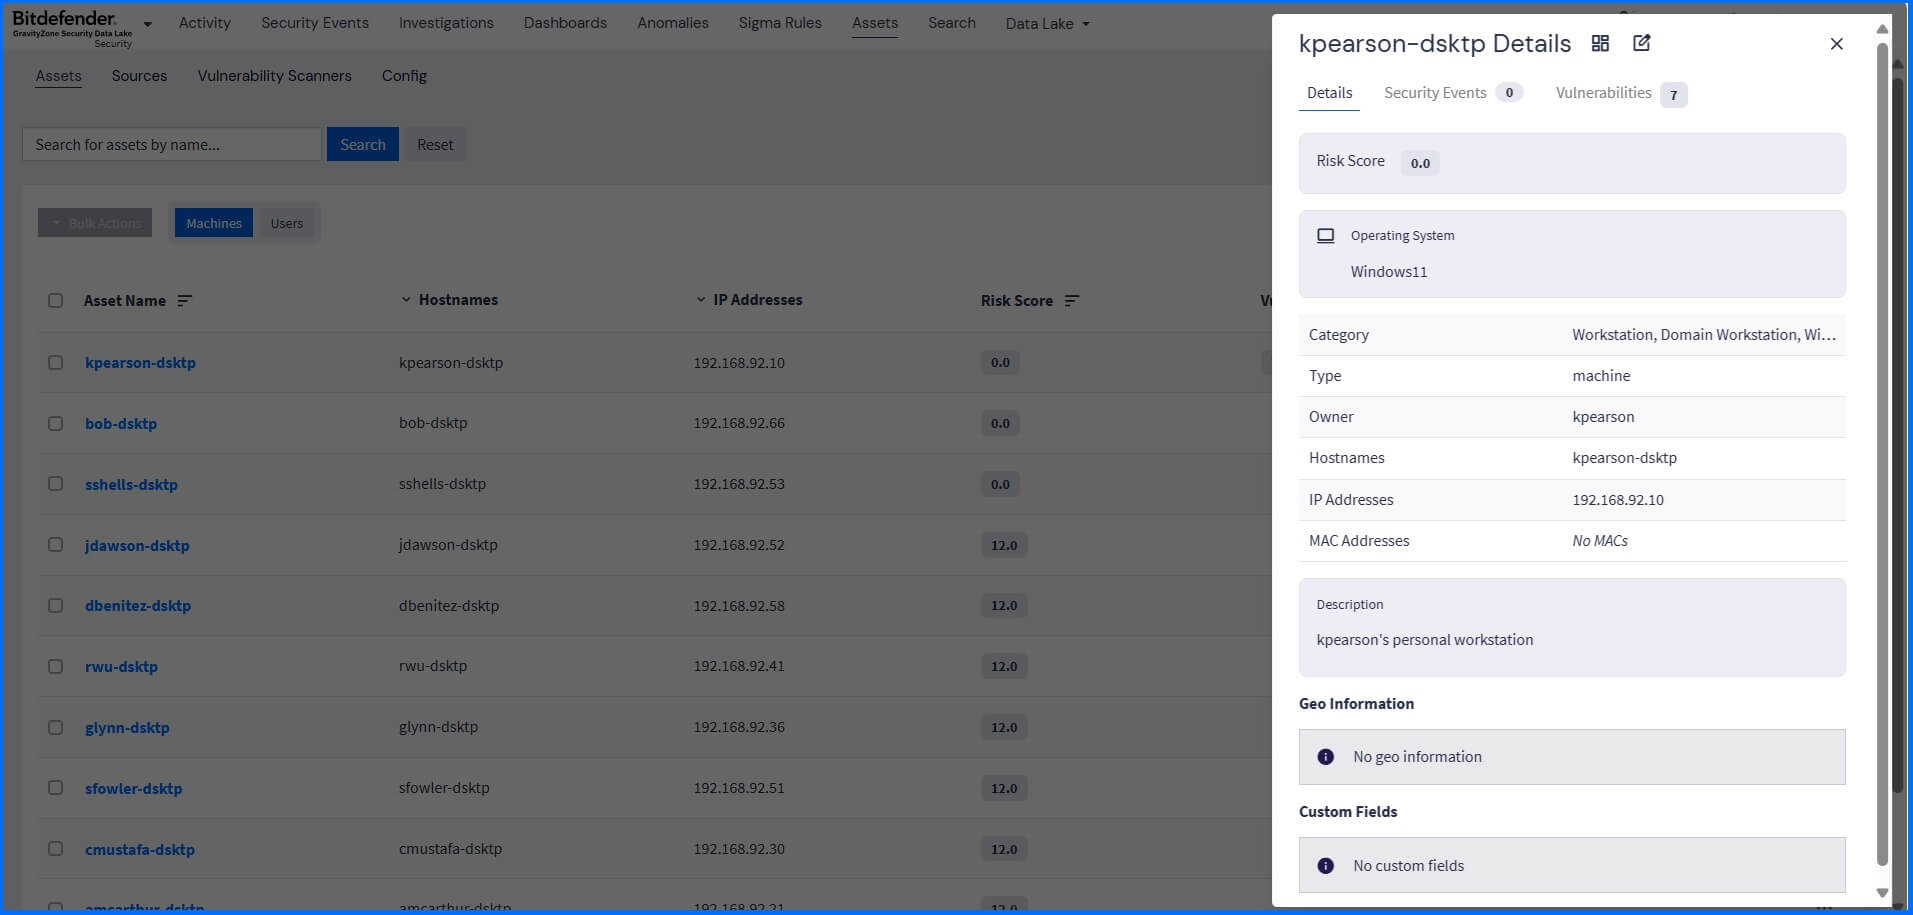
The Security Data Lake provides two types of assets: machine assets and user assets. Machine assets include different types of hardware located across your network, such as endpoints and firewalls. User assets include system and user accounts.
You can access detailed asset information in the Assets section. It provides details such as hostname or IP address, security events, and vulnerabilities discovered in the selected asset. It also provides an asset risk score calculated based on the event risk score and any discovered vulnerabilities by the integrated vulnerability scanner.
 |
Anomaly Detection
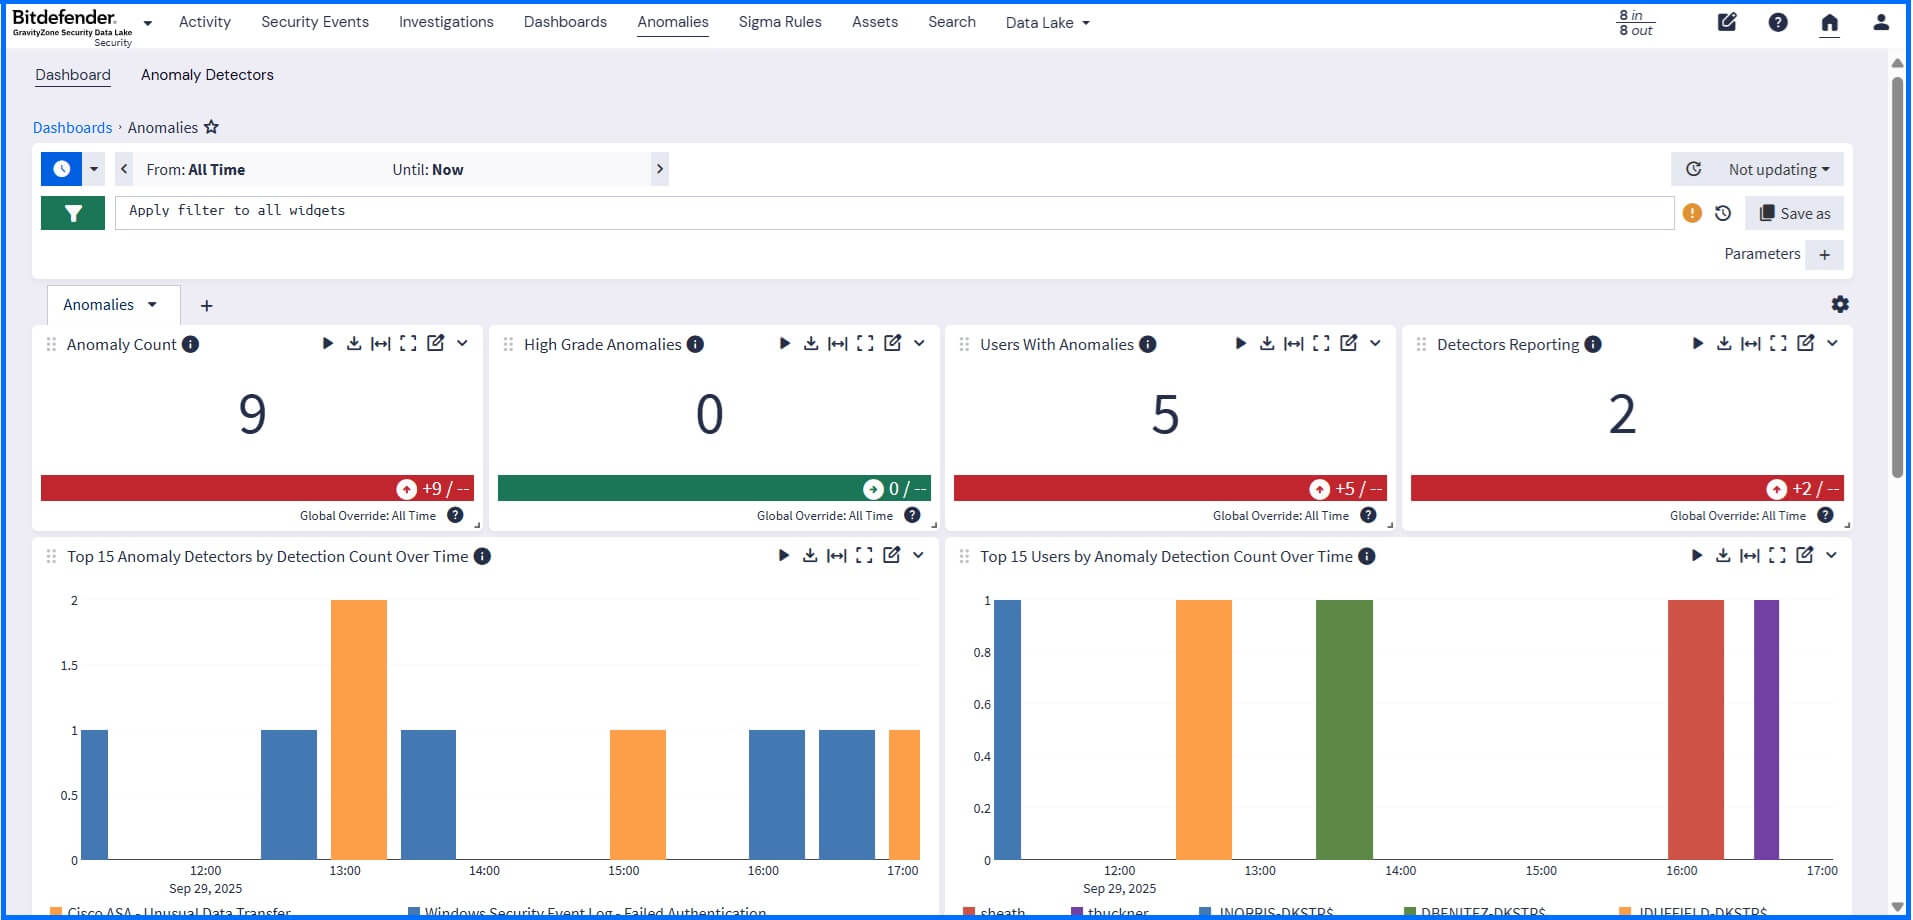
Anomaly detection in the Security Data Lake leverages advanced behavioral analysis to identify deviations from normal organizational activity. Once you have activated the Core:Anomaly Detection Add-on in the Content Packs section, you can choose exactly which products or data sources to monitor for unusual behavior in the Anomalies > Anomaly Detectors section.
This analysis begins after the system receives, normalizes, and enriches your log data, ensuring that all detections are based on clean, structured information. This processing allows you to receive events whenever something operates outside of normal levels. The results are presented in a dedicated visual dashboard, from which you can use the search functionality to drill down and quickly determine the root cause of the anomalous behavior.
 |
Detailed information about anomaly detection can be found at our Bitdefender Support Center here.
Investigations
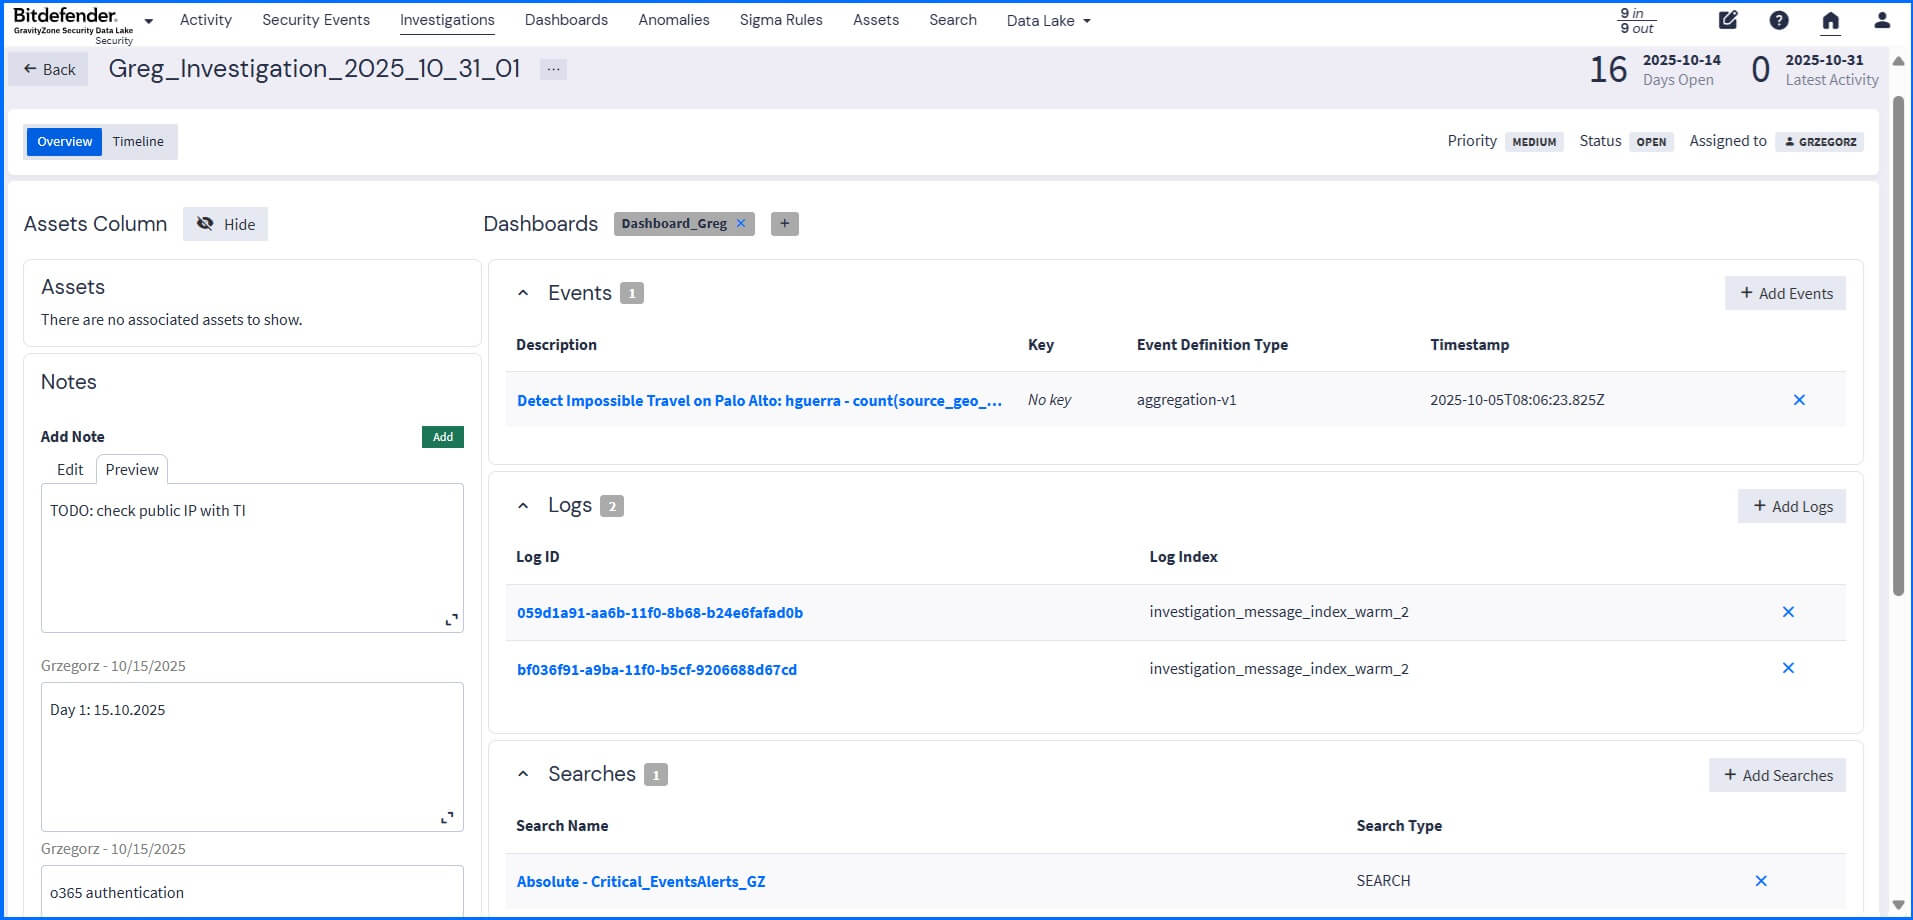
An investigation is typically started based on a high-risk trigger, such as a received notification, an anomaly detection, or a high asset risk score, requiring immediate analysis.
Creating an investigation, you can add dashboards, logs, saved searches, and associated events (including those resulting from anomaly detection) as evidence entities. This evidence, grouped in one centralized location, allows you to view the full context of an issue, while the integrated timeline functionality outlines key events and messages that are part of the investigation.
 |
Detailed information about investigations can be found at our Bitdefender Support Center here.
Audit Logs
The audit log is enabled by default. To check its status, navigate to Enterprise > Audit Log. The audit log tracks changes made by users to the Data Lake system and records all state changes in the database. This functionality allows you to search and filter audit log entries via the interface, then export the results as either JSON or CSV, or query the data using the REST API. The audit log is enabled by default. To check its status, navigate to Enterprise > Audit Log. The audit log tracks changes made by users to the Data Lake system and records all state changes in the database. This functionality allows you to search and filter audit log entries via the interface, then export the results as either JSON or CSV, or query the data using the REST API.
Compliance Requirements
The centralized collection and long-term retention of all security and activity logs within the Security Data Lake also assist you in meeting compliance requirements. Since event logs contain documentation of activity occurring across the environment, they act as essential documentation for audits against standards such as General Data Protection Regulation (GDPR), Payment Card Industry Data Security Standard (PCI DSS), Federal Information Security Management Act (FISMA), and the Health Insurance Portability and Accountability Act (HIPAA).
Data Lake in Action: Supporting Bitdefender MDR
The Security Data Lake, when integrated with our Managed Detection and Response (MDR) service, grants access to third-party telemetry (firewalls, cloud services, etc.), expands the view of your entire environment. The list of supported 3rd party firewall telemetry by Bitdefender MDR includes Palo Alto Networks, Check Point, Cisco ASA, Fortinet, Juniper, pfSense, and SonicWall.
Our MDR team can run queries across all enriched data to quickly and precisely detect Indicators of Compromise (IoCs), moving beyond Bitdefender EDR and XDR events to correlate activity across the entire infrastructure. This capability allows for identifying threats earlier in the attack chain, reducing noise through risk-based prioritization.
Recommended Content
To learn more about the defense-in-depth security architecture we recommend reading the next article Response.
More Resources
Bitdefender Security Data Lake official web page: Bitdefender Security Data Lake
GravityZone Security Data Lake datasheet: Bitdefender GravityZone Security Data Lake and Data Lake for MDR datasheet
Discover the Security Data Lake full potential with our dedicated video masterclasses: Redefining SIEM with Bitdefender - GravityZone Security Data Lake